Solar is no longer a technology waiting for its moment. It has already arrived — and the decade from 2026 to 2035 will determine just how completely it reshapes the global energy system.
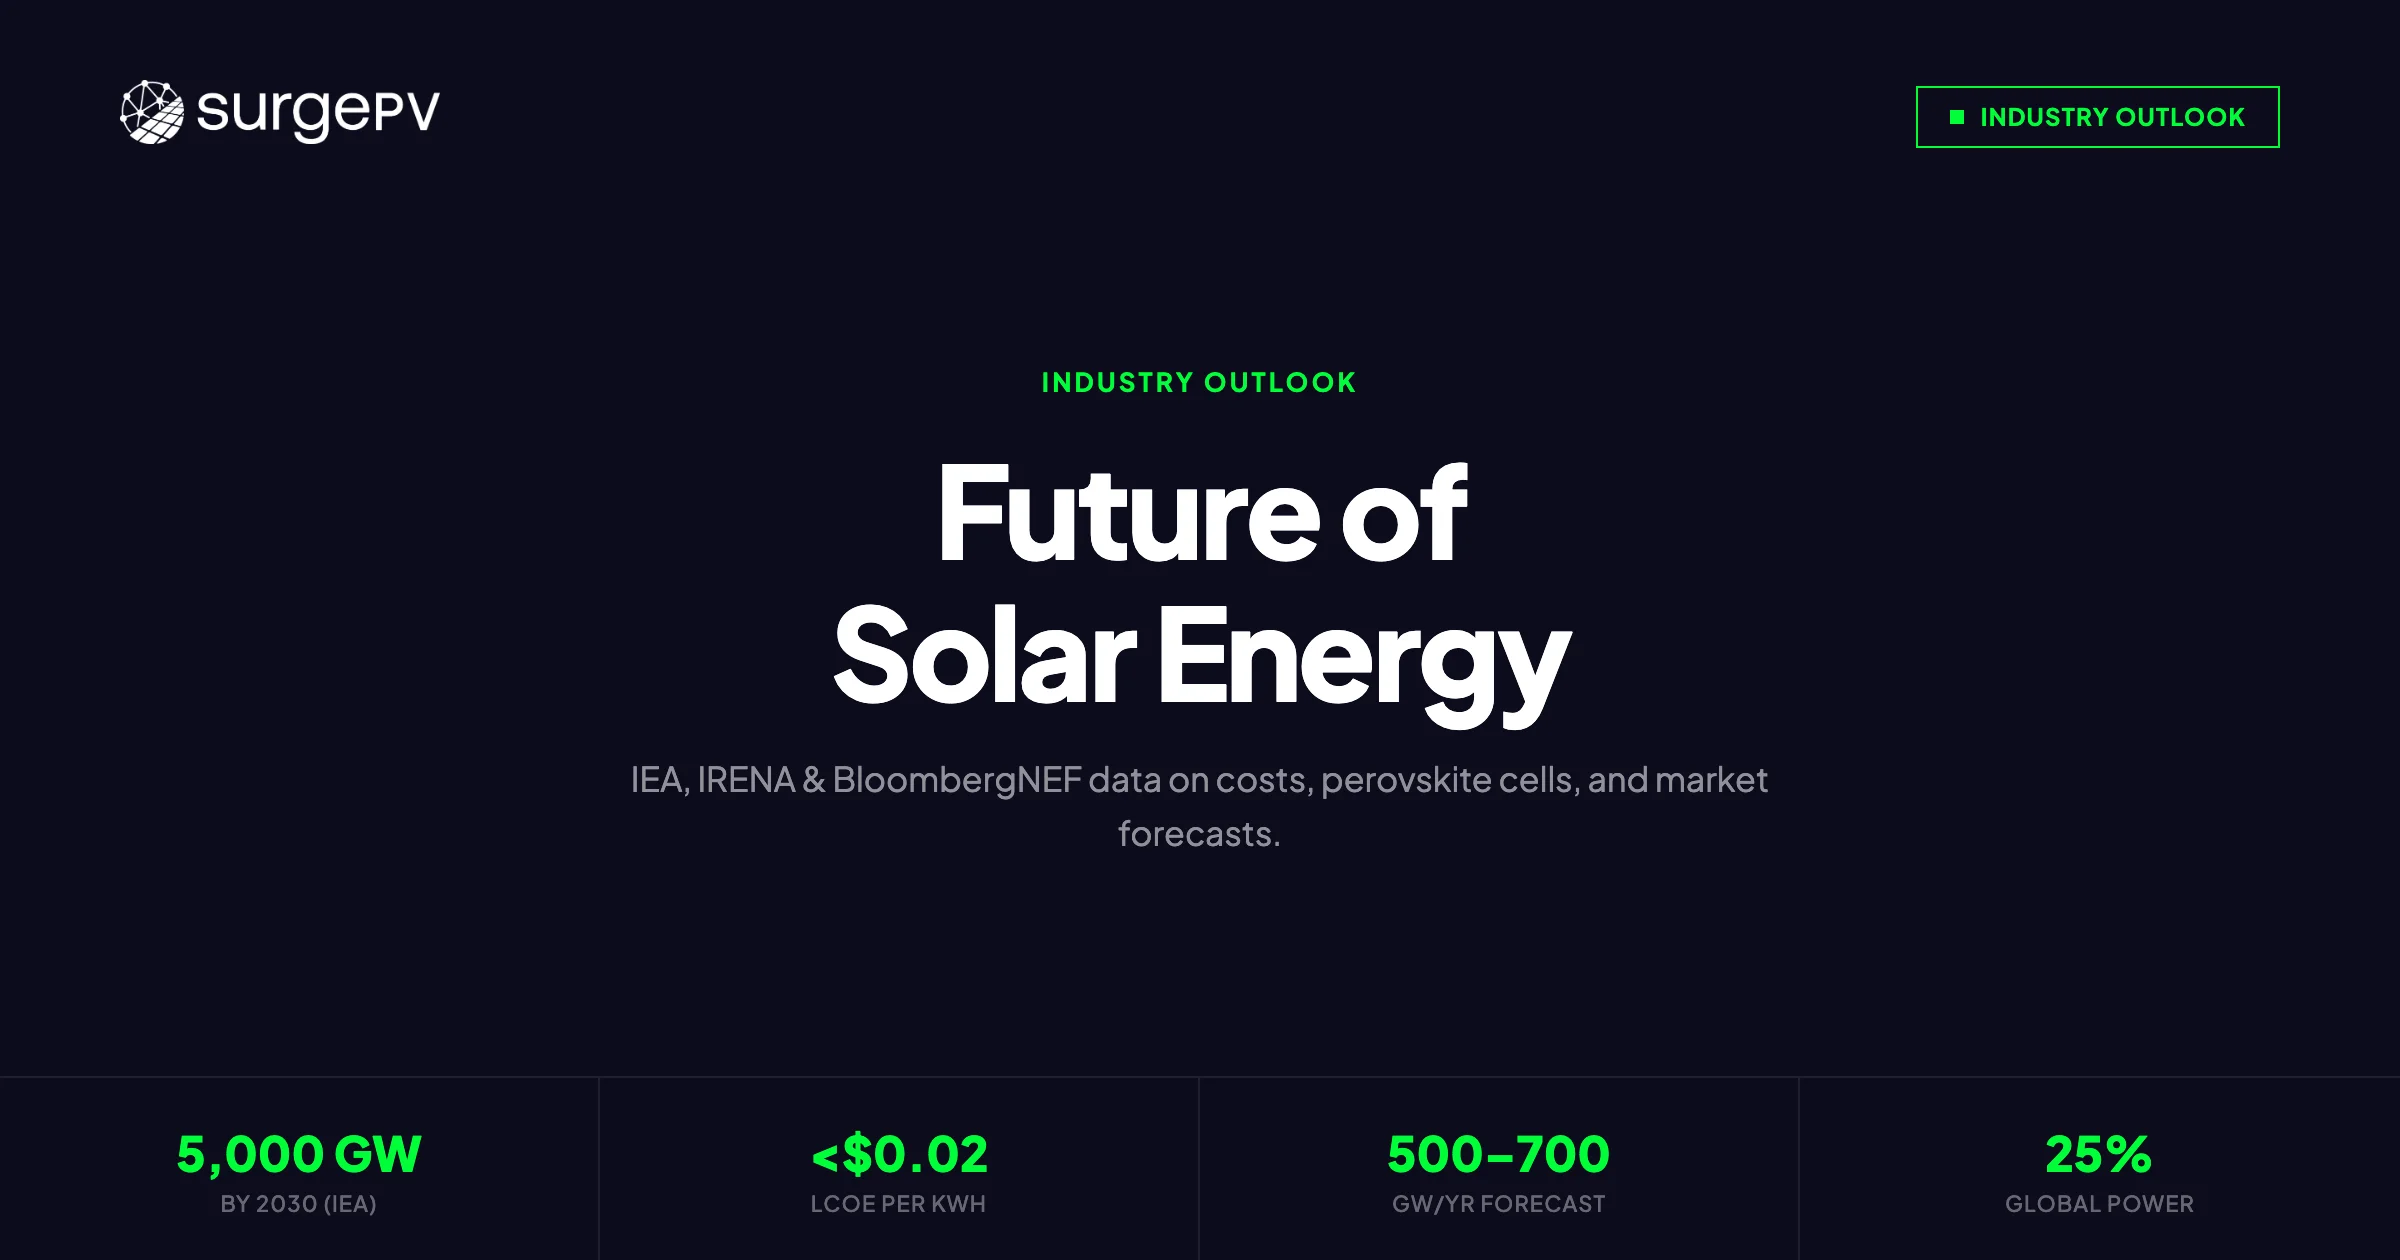
In 2024, the world installed more solar capacity in a single year than it added from all energy sources combined as recently as 2010. The IEA’s World Energy Outlook 2024 declared solar “the cornerstone of the global energy transition” and revised upward its capacity forecasts for the fifth consecutive year. IRENA projects that solar alone could supply 25% of global electricity by 2030. BloombergNEF puts utility-scale solar LCOE below $0.03/kWh in favorable markets today, with further declines guaranteed by manufacturing scale.
For solar installers and commercial energy developers, this is not abstract good news. It translates directly into the pace of customer decision-making, the competitive dynamics of the proposal process, the technology choices available on every project, and the sophistication that clients now expect from the professionals they hire. The installer who understands the technology roadmap — perovskite commercialization, bifacial market share, agrivoltaics, hydrogen from solar, the V2G integration curve — is the installer who can hold a room and close a commercial contract.
This guide covers the full 2026–2035 outlook: where the data points, what the technology shifts mean at the project level, and how the role of the solar professional evolves alongside the market.
TL;DR — Future of Solar Energy 2026–2035
Solar will be the world’s largest electricity source by the early 2030s. Module costs continue falling; perovskite-silicon tandems hit commercial markets 2026–2028; battery storage reaches economic parity across most markets by 2027. Agrivoltaics, green hydrogen, and V2G integration expand the addressable market for installers significantly. Installers who pair field expertise with professional-grade solar design software will capture the most value as project complexity increases.
In this guide:
- Latest 2026 updates: solar capacity additions, cost milestones, and market structure
- Swanson’s Law and the module cost learning curve through 2035
- Perovskite solar cell commercialization timeline and what it means for installers
- Bifacial panel market growth and deployment best practices
- Agrivoltaics: the fastest-growing solar segment
- Solar-plus-storage integration economics
- EV and solar synergy: V2G, smart charging, and load management
- Green hydrogen from solar: the industrial scale opportunity
- Grid parity data by country — who has crossed it and who is next
- Solar job market growth through 2030
- The installer’s role in the energy transition
- How solar design software evolves with the market
Latest Updates: Solar Energy Outlook 2026
The opening months of 2026 confirm a market in structural acceleration, not cyclical growth. Several milestones crossed in 2024–2025 set the trajectory for the full decade.
Global installed capacity crossed 2,000 GW in 2024. The IEA reported that cumulative solar PV capacity reached 2,077 GW by year-end 2024, a figure that would have seemed implausible when the first IEA capacity forecasts were published in 2010. Annual additions in 2024 reached approximately 447 GW — led by China (277 GW), the European Union (65 GW), the United States (42 GW), and India (25 GW). The IEA’s Stated Policies Scenario projects 5,000+ GW installed by 2030 and over 14,000 GW by 2050 under the Net Zero Emissions pathway.
Module spot prices hit historic lows. Chinese mono-PERC module spot prices fell below $0.09/Wp in H2 2024 — a level that makes solar the cheapest electricity source in virtually every geography on earth when evaluated on LCOE. BloombergNEF’s H2 2024 Solar Outlook reported that utility-scale solar LCOE reached $24/MWh in the sunniest US markets, below the operating cost of existing coal in those regions.
Battery storage deployments crossed 100 GWh annually. BNEF reported that global battery energy storage deployments reached 105 GWh in 2024, with utility-scale systems accounting for 75%. This milestone marks the point at which storage is no longer a specialized add-on but a standard component of solar project planning.
The United States Inflation Reduction Act continues to drive domestic manufacturing. US solar module manufacturing capacity crossed 50 GW/year in 2025, up from less than 10 GW in 2022, as IRA incentives attracted $100B+ in announced clean energy manufacturing investment. First Solar, Qcells, and new entrants from Malaysia and Vietnam have expanded US capacity substantially.
India’s solar market accelerated past targets. India installed 25 GW in 2024, tracking toward its revised 500 GW renewable target by 2030. The government’s PM Surya Ghar Muft Bijli Yojana (rooftop solar subsidy program) launched in 2024 with ₹75,000 crore in funding and a target of 10 million rooftop systems.
Europe responded to energy security pressures. The EU’s Solar Energy Strategy targets 600 GW of installed solar by 2030 — requiring roughly doubling the pace of 2023 additions every year. REPowerEU financing and accelerated permitting reforms in Germany, Spain, Poland, and the Netherlands are beginning to show results in permit approval timelines.
Key Takeaway
The 2026 solar market is structurally different from 2020. Module cost is no longer the binding constraint in most markets — grid interconnection, permitting speed, and the quality of the pre-sales and design process are. Installers who can quote faster, design more accurately, and document more professionally win more projects in this environment.
Swanson’s Law: The Module Cost Learning Curve Through 2035
Understanding where module costs are going requires understanding why they fell so far so fast.
Swanson’s Law — named after SunPower founder Richard Swanson — states that the cost of solar modules falls approximately 20% for every doubling of cumulative shipped volume. It is an empirical observation, first noted in the 1970s, that has held with remarkable consistency across five decades of solar manufacturing scale-up.
The numbers are stark. In 1976, crystalline silicon modules cost approximately $76/Wp in 2024 dollars. By 2010, this had fallen to roughly $1.80/Wp. By 2020, to $0.20/Wp. By 2024, Chinese mono-PERC modules traded at $0.09–$0.11/Wp on spot markets. This represents a 99.9% cost reduction in approximately 50 years — with no signs of the learning curve flattening.
What drives the learning curve?
Module cost reductions come from several compounding effects:
- Manufacturing scale: Larger wafer sizes (182mm and 210mm M10/G12 formats), automated production lines, and integrated upstream polysilicon-to-module supply chains reduce per-unit cost.
- Efficiency improvements: Higher cell efficiency means the same number of watts requires less silicon, glass, frame, and labor per unit.
- Material substitution: The shift from silver to copper metallization in next-generation cells reduces materials cost. Silver consumption per cell has fallen 80% since 2012 and is projected to fall another 60% by 2030.
- Supply chain maturity: Polysilicon costs fell from $300/kg in 2011 to under $5/kg in 2024 as Chinese manufacturers expanded capacity dramatically.
The 2026–2035 forecast
BloombergNEF’s Long-Term Energy Outlook 2024 projects that module costs will stabilize in the $0.06–$0.08/Wp range through 2027–2028 — a floor set partly by raw material costs and partly by the need for margins that sustain investment in next-generation manufacturing. After commercial deployment of perovskite-silicon tandem cells (see next section), a further step-change reduction is possible, with BNEF modeling scenarios where module costs fall to $0.04–$0.05/Wp by 2032–2035 for high-efficiency tandems at scale.
What this means for installers
As module costs compress toward a floor, the cost structure of a solar project shifts. In 2015, modules represented roughly 50–60% of a typical residential system cost. By 2024, they represented 20–30%. By 2030, the module may represent 10–15% of all-in system cost in mature markets, with labor, permitting, interconnection, and customer acquisition making up the remainder.
This has a direct implication for competitive differentiation: the installer who wins on module price is playing a diminishing-returns game. The installer who wins on speed-to-quote, design accuracy, and professional presentation is competing on dimensions that are becoming more valuable as the market matures.
Solar design software that automates shade analysis, generates production estimates, and outputs bankable proposals becomes the operational foundation of a competitive installation business — not an optional upgrade.
Perovskite Solar Cells: Commercialization Timeline and Market Impact
No technology in the solar industry has generated more research attention — or more commercial anticipation — than perovskite solar cells. Understanding the realistic commercialization timeline is essential for any professional making technology recommendations to clients today.
What is perovskite solar?
Perovskite solar cells use a crystal structure with the formula ABX₃ — typically a lead-halide hybrid compound — as the light-absorbing layer. The key advantage is that perovskite absorbers can be tuned to absorb different parts of the solar spectrum by varying their chemical composition, making them ideal for tandem architectures that capture more of the sun’s energy than single-junction silicon cells.
Efficiency trajectory
Lab-scale perovskite-silicon tandem cells have advanced rapidly:
- 2019: 28.0% certified efficiency (Helmholtz-Zentrum Berlin)
- 2021: 29.5% (Helmholtz-Zentrum Berlin / LONGi)
- 2022: 31.3% (KAUST)
- 2023: 33.9% (KAUST — surpassing the single-junction silicon theoretical limit)
- 2024: 34.6% (Fraunhofer ISE / LONGi collaborative result)
The theoretical efficiency limit for single-junction silicon is approximately 29.4%. The tandem architecture breaks through this ceiling by stacking two absorber materials, each optimized for a different portion of the spectrum. Commercial silicon modules deliver 20–23% in practice. Commercial perovskite-silicon tandems are expected to deliver 28–32% at the module level, representing a 25–40% improvement in power density.
Commercialization timeline
Oxford PV (UK/Germany) has operated a 100 MW/year perovskite-silicon tandem production line in Brandenburg since 2023, with 26.9%-efficient commercial modules entering pilot installations. The company has announced expansion to 1 GW/year capacity with 2026 target dates. Saule Technologies (Poland) and CubicPV (US) are also advancing commercial production.
The most likely commercialization scenario, based on current manufacturing readiness levels:
- 2026–2027: First commercial perovskite-silicon tandem modules available in volume from 2–3 manufacturers at a price premium of 40–60% over standard mono-PERC.
- 2028–2030: Premium narrows to 15–25% as manufacturing scale increases and yield improves. Tandem modules begin capturing significant share in space-constrained commercial and industrial rooftop applications where higher power density justifies cost.
- 2031–2035: Perovskite-silicon tandems become the standard high-efficiency product, with all-perovskite tandems (no silicon) entering the pipeline from research to production.
The stability challenge
The primary unresolved barrier to mass deployment is long-term stability. Standard silicon modules have 25-year performance warranties with degradation rates of 0.3–0.5%/year. Early perovskite cells degraded far faster. Current research cells demonstrate 0.5–1.0%/year degradation under accelerated aging, but multi-year outdoor field data at commercial scale does not yet exist. Manufacturers offering 25-year warranties on tandem products will need reliable encapsulation solutions and demonstrated field performance data — likely available by 2027–2028 from the current generation of pilot installations.
Pro Tip
When clients ask about perovskite solar today, the honest answer is: the technology is real, the efficiency gains are validated, and commercial products will be available within 2–3 years. For projects being designed and installed in 2026, standard mono-PERC or TOPCon silicon remains the correct specification. Perovskite-silicon tandems become relevant for space-constrained C&I rooftop projects from approximately 2028 onward. Read our full deep-dive: Perovskite Solar Cells: The Next Big Thing?
Bifacial Panels: Market Growth and Deployment Best Practices
Bifacial solar panels — which generate power from both the front and rear face of the module — have moved from a premium specialty product to the mainstream market in under five years. Understanding the bifacial market trajectory and how to deploy bifacial systems correctly is now a baseline competency for commercial solar professionals.
Market share trajectory
BNEF reports that bifacial modules represented approximately 80% of global module shipments in 2024, up from less than 10% in 2019. The shift was driven by two factors: the near-universal adoption of PERC cell technology (which enables bifacial production at minimal additional cost) and the cost reduction of transparent backsheets and dual-glass module formats.
By 2026, bifacial modules are the default product across essentially all commercial and utility-scale applications. Monofacial modules persist in a narrow segment of price-sensitive residential markets and specific applications where rear-side shading eliminates bifacial gain.
Bifacial gain: what the data shows
Bifacial gain — the additional energy output from rear-side irradiance — varies significantly by installation type:
| Installation Type | Typical Bifacial Gain |
|---|---|
| Ground mount, white gravel albedo (0.35) | 10–20% |
| Ground mount, green grass albedo (0.25) | 8–15% |
| Rooftop, standard membrane (0.1–0.15 albedo) | 3–7% |
| Agrivoltaic elevated mounting (reflective ground) | 15–25% |
| Floating solar (water albedo 0.07) | 2–5% |
| Vertical bifacial (east-west orientation) | 20–35% combined vs. single-face horizontal |
The key variables are ground albedo (reflectivity), mounting height above ground, and row-to-row spacing. Increased height and row spacing improve rear-side irradiance but require more land and structural cost. The optimization point depends on land cost and local electricity prices.
Modeling bifacial systems accurately
Bifacial simulation has become a required capability for any professional solar software tool. The physics-based bifacial irradiance model requires inputs that go beyond standard flat-plate calculations: module bifaciality factor (typically 0.65–0.85 for commercial bifacial products), ground albedo by surface type, mounting height, and row pitch. Systems modeled without bifacial gain calculations understate production by 5–20%, which affects financing, ROI projections, and customer expectations.
For flat commercial rooftops, bifacial gain modeling is particularly important: the standard assumption of 5% bifacial gain for a roof membrane can double if white TPO or ballasted gravel increases albedo significantly.
Agrivoltaics: The Fastest-Growing Solar Segment
Agrivoltaics — the co-location of solar panels and agricultural activity on the same land — has moved from academic research to one of the fastest-growing deployment models in global solar. The growth numbers are significant: the global agrivoltaic market was valued at approximately $3.1 billion in 2023 and is projected to reach $9.3 billion by 2028, according to Wood Mackenzie, representing a 25% CAGR.
Why agrivoltaics is growing
Three structural forces are driving agrivoltaic adoption:
-
Land constraint: As utility-scale ground-mount solar competes with agriculture for land in densely populated countries (Japan, South Korea, Germany, Italy, Netherlands), agrivoltaics resolves the political and economic conflict by serving both uses simultaneously.
-
Yield data: Multi-year studies at Fraunhofer ISE, Oregon State University, and multiple Japanese national research institutes have demonstrated that many crops — lettuce, potatoes, clover, wheat, lavender — maintain 80–95% of reference yields under appropriate panel configurations, while some shade-tolerant crops (spinach, kale, arugula) show yield increases of 5–15% due to reduced thermal stress.
-
Policy support: Japan’s FIT framework for agrivoltaics, France’s Appel d’Offres for agri-PV, Germany’s BVWP agrivoltaic support, and Italy’s PNRR Agri-PV grants totaling €1.5 billion have created commercially viable project economics.
Configuration types
Agrivoltaic installations vary substantially in design:
- Elevated fixed-tilt: Panels mounted at 3–5 meters on tall racking, allowing farm equipment to pass underneath. Common in Japan, France, and the US Midwest.
- Tracking agrivoltaic: Single-axis trackers at elevated height, enabling dynamic shading optimization by crop growth stage. Higher yield from solar, more complex engineering.
- Vertical bifacial: East-west oriented vertical panels at row boundaries — highly land-efficient, compatible with most crops, minimal shadow penetration.
- Greenhouse-integrated: Semi-transparent panels replacing glass or polycarbonate glazing on commercial greenhouses. Energy-neutral or energy-positive greenhouses.
The installer opportunity
Agrivoltaic projects represent a meaningful revenue opportunity for commercial solar installers with C&I project experience. Typical elevated agrivoltaic systems run at $1.20–$1.60/Wp installed (compared to $0.80–$1.00/Wp for conventional ground mount), reflecting the additional structural cost and engineering complexity. Project sizes range from 500 kW to 50+ MW. The addressable market in the US alone is estimated at 380,000+ km² of cropland that could theoretically host agrivoltaic systems — a figure that implies a multi-trillion-dollar installation opportunity over a 20–30 year horizon.
Key Takeaway
Agrivoltaics is the segment most likely to create a new category of specialized installer over the next decade. The technical and regulatory complexity — agricultural planning, elevated structural engineering, crop yield modeling — creates a meaningful moat for early specialists. The segment is growing fast enough that building this expertise in 2026 positions a company well for the 2028–2032 growth wave.
Solar-Plus-Storage Integration: The New Project Standard
The question of whether to add battery storage to a solar installation has shifted from “sometimes appropriate” to “almost always worth modeling” across most commercial markets. The economics crossed a structural threshold in 2024, and the implications for how installers design and present proposals are substantial.
The storage cost curve
Lithium iron phosphate (LFP) battery costs at the pack level fell below $100/kWh in 2024 — a figure BloombergNEF had identified in prior forecasts as the threshold at which 4-hour storage becomes economically competitive in most US and European electricity markets. By Q3 2024, BNEF reported US utility-scale LFP costs averaging $97/kWh and residential LFP (all-in installed) averaging $350–$450/kWh.
The trajectory continues downward. BNEF projects utility-scale LFP pack costs reaching $75/kWh by 2026 and $60/kWh by 2030. Residential installed costs are projected to fall to $250–$300/kWh by 2028 as installation standardization and demand-driven volume purchasing reduce soft costs.
Where storage adds value
For commercial installers, the storage value stack has multiple layers that vary by market:
- Self-consumption optimization: Storing midday solar production for evening use. Value equals the difference between the export rate and the import rate — significant wherever net metering rates have been cut (California NEM 3.0, Hawaiian CBRE, Australian export limits).
- Time-of-use arbitrage: Charging during off-peak rate periods (including from the grid when solar is insufficient) and discharging during peak rate periods. Worth $80–$200/year per residential kWh of usable capacity in TOU markets.
- Demand charge reduction: For commercial and industrial customers with demand charges ($10–$25/kW/month in many US utility tariffs), even modest storage capacity (50–100 kWh) can yield demand charge savings of $500–$2,000/month.
- Backup power: Resilience value quantified by avoided cost of business interruption or generator fuel. Increasingly, this is the primary sales driver in markets with grid reliability concerns.
- Virtual power plant (VPP) participation: Aggregated residential and commercial storage enrolled in utility VPP programs can earn $200–$600/year per battery system in markets with active VPP incentives (Pacific Gas & Electric, Hawaiian Electric, AGL in Australia, Octopus Energy in UK).
Solar-plus-storage design complexity
Adding storage to a solar proposal meaningfully increases design complexity. The optimal battery sizing depends on load profile, solar production curve, utility rate structure, demand charge intervals, and backup capacity requirements. Proposals that model storage savings correctly — rather than using rule-of-thumb estimates — are materially more accurate and professionally differentiated.
Solar proposal software that integrates rate structure analysis, storage dispatch modeling, and multi-scenario comparison allows installers to present storage economics in a way that builds client confidence and closes deals faster. This capability is increasingly what separates tier-one commercial solar contractors from the field.
EV and Solar Synergy: V2G, Smart Charging, and Load Management
Electric vehicle adoption is creating a new category of solar project economics that was essentially absent from the installer toolkit five years ago. The EV fleet is becoming a distributed battery asset — and the solar installer is positioned to be the integrator who monetizes it.
EV adoption trajectory
The IEA’s Global EV Outlook 2024 reported that global EV sales reached 14 million in 2023, representing approximately 18% of global new car sales. China alone sold 8.1 million EVs. The IEA’s Stated Policies Scenario projects global EV stock reaching 300 million by 2030. In leading markets — Norway (92% EV share of new sales in 2024), Iceland (76%), Sweden (60%), the Netherlands (38%) — the EV load is already reshaping residential electricity consumption profiles.
A typical EV adds 2,000–4,000 kWh of annual electricity consumption to a household — roughly equivalent to adding a second home on the grid. Without smart charging, this load peaks in the evening when solar production is zero and grid demand is high. With smart solar charging, EV batteries are charged from midday solar surplus, turning a grid stress into a self-consumption asset.
Vehicle-to-grid (V2G) technology
V2G technology enables EV batteries to discharge back to the home (V2H) or to the grid (V2G) during peak periods. This transforms every EV into a potential 50–100 kWh residential battery with a marginal cost close to zero for the installer — the customer already paid for the vehicle.
Current V2G-capable vehicles include the Nissan Leaf (since 2013), Mitsubishi Outlander PHEV, Ford F-150 Lightning (V2H only), Hyundai Ioniq 5/6, and Kia EV6. Bidirectional charging hardware from companies including Wallbox, ABB, and SolarEdge is commercially available.
The economic value of V2G in well-structured markets is significant. A modeling study by the Rocky Mountain Institute estimated that V2G-enabled residential solar households in California under NEM 3.0 could earn $600–$1,200/year in grid services revenue while also reducing electricity bills by $800–$1,400/year. The combined EV-solar-storage value stack fundamentally changes the ROI calculation for residential solar in these markets.
What this means for solar installers
EV integration is not a separate business — it is an extension of the solar installer’s natural scope. Installers who add EV charger installation to their service offering expand revenue per customer by $1,500–$4,000 and capture the V2G smart charging opportunity that requires solar system integration. The solar design software that models EV charging load, smart dispatch, and V2G economics alongside solar production is becoming a competitive differentiator.
For commercial and fleet applications, the opportunity is larger still. A 50-vehicle fleet depot with a 200 kW solar canopy, 500 kWh of stationary storage, and bidirectional fleet charging is a multi-million-dollar project with compelling economics — exactly the type of complex, integrated project that rewards installers with sophisticated modeling and proposal capabilities.
Hydrogen from Solar: The Industrial Scale Opportunity
Green hydrogen — hydrogen produced by electrolyzing water using renewable electricity — is frequently discussed as the future of solar energy’s industrial application. The actual market outlook is more nuanced and worth understanding precisely, because it informs both technology investment decisions and the types of projects that installers in the commercial segment will encounter.
The economics of green hydrogen
Electrolysis efficiency has improved significantly. PEM (proton exchange membrane) electrolyzer efficiency reached approximately 70–75% (electricity to hydrogen) at commercial scale by 2024, up from 60–65% five years earlier. Electrolyzer capital costs fell from $1,200–$1,500/kW in 2020 to approximately $600–$800/kW by 2024, with IRENA projecting further falls to $300–$400/kW by 2030.
At current electricity prices, green hydrogen from solar costs approximately $3–6/kg in the sunniest markets (MENA, Chile, Australia) and $5–10/kg in European and North American markets. Grey hydrogen (from natural gas) costs $1–2/kg. The gap is narrowing as solar costs fall and carbon pricing increases the effective cost of grey hydrogen, but full economic parity in most markets is a 2030–2035 story, not a 2026 story.
Where the investment is going
Despite the current cost gap, green hydrogen investment is substantial:
- The EU’s REPowerEU plan targets 10 million tonnes/year of domestic green hydrogen production by 2030, with €35 billion in direct funding.
- The US Inflation Reduction Act’s $3/kg production tax credit for “clean hydrogen” (effectively a $3/kg subsidy) makes green hydrogen economically competitive with grey hydrogen in the US immediately.
- Australia, Saudi Arabia (NEOM), Chile, and Morocco are developing gigawatt-scale green hydrogen export projects targeting 2028–2032 delivery.
The installer opportunity in hydrogen
For commercial solar installers, the green hydrogen opportunity is primarily in industrial behind-the-meter installations: manufacturing facilities, refineries, port operators, and agricultural producers using ammonia (green hydrogen derivative) as fertilizer. These are projects where the scale of solar — 5 MW to 500 MW — and the complexity of integration with electrolyzer systems creates significant work for specialized solar contractors.
This is not a 2026 mainstream market. It is a 2028–2035 growth segment that rewards early expertise development.
Grid Parity by Country: Who Has Crossed It and Who Is Next
Grid parity — the point at which solar LCOE equals or falls below the retail electricity price — is now largely a historical milestone rather than a future aspiration. The more useful question for 2026 is: which markets have crossed socket parity (where unsubsidized solar is cheaper than grid electricity for end users), and which are next?
Markets that have crossed grid parity
According to BloombergNEF’s H2 2024 Solar Outlook, unsubsidized solar is cheaper than new-build gas generation in all major electricity markets globally. More relevantly for distributed solar, solar self-consumption economics are positive without subsidy in:
| Country/Region | Retail Electricity Price (2024 avg.) | Solar LCOE (residential, 2024) | Self-Consumption Payback |
|---|---|---|---|
| Germany | €0.31/kWh | €0.07–0.10/kWh | 5–8 years |
| Italy | €0.28/kWh | €0.07–0.10/kWh | 5–8 years |
| Australia | A$0.30–0.38/kWh | A$0.06–0.09/kWh | 4–7 years |
| California (US) | $0.29–0.40/kWh | $0.08–0.12/kWh | 5–9 years |
| Japan | ¥32–38/kWh | ¥8–12/kWh | 6–10 years |
| Spain | €0.19–0.26/kWh | €0.06–0.09/kWh | 6–10 years |
| Brazil | R$0.85–1.10/kWh | R$0.25–0.40/kWh | 4–6 years |
| India | ₹7–12/kWh | ₹3–5/kWh | 4–7 years |
Markets approaching grid parity (2026–2030)
Several markets where high electricity prices have historically been held down by fossil fuel subsidies are now approaching the grid parity crossover as subsidy reform progresses:
- Mexico: Electricity prices rising as CFE subsidy reform proceeds; solar payback approaching 6–8 years in northern states.
- Thailand: Revised rooftop solar policies and electricity price increases pushing payback below 8 years.
- Vietnam: Grid expansion constraints and rising industrial electricity prices making C&I solar attractive without subsidy.
- Nigeria/Ghana/Kenya: Unreliable grid supply means the effective cost of electricity (including generator backup cost) is $0.25–$0.40/kWh, making solar-storage cost-competitive today.
The import of grid parity for installers
The significance of grid parity is not just economic — it is psychological. In pre-parity markets, solar sales require customers to accept the premise that subsidies and incentives make solar worthwhile despite a higher apparent cost. In post-parity markets, the frame reverses: not installing solar becomes the choice that requires justification. This shifts the installer’s sales conversation from subsidy education to ROI confirmation — a materially faster and more scalable sales process.
Pro Tip
In post-parity markets, the most effective proposal format leads with the 10-year cumulative savings figure — not the payback period. A 7-year payback on a system that saves €18,000 over 20 years is a better sales message than “pays back in 7 years.” Solar proposal software that calculates and presents 20-year cash flow projections clearly is essential for this framing.
Solar Job Market Growth: The Numbers Through 2030
Solar is already the fastest-growing occupation in the United States by percentage growth rate. The job market numbers reflect the underlying capacity growth, and the projections through 2030 are significant for anyone building a solar business or workforce.
Current employment
The IEA’s World Energy Employment 2024 report estimated that global solar energy employment reached approximately 4.9 million jobs in 2023, with solar PV accounting for approximately 4.1 million of that total. China employs the largest absolute number — roughly 2.7 million — but the US, EU, India, and Brazil are the primary growth markets for the 2026–2030 period.
In the United States, the Bureau of Labor Statistics’ Occupational Outlook Handbook reports that solar installer employment grew 52% between 2020 and 2023 and projects a further 22% growth by 2032 — the fastest growth of any occupational category tracked. The 2024 estimate of approximately 260,000 solar installers in the US is projected to reach 380,000–420,000 by 2030.
EU Solar Job Projections
SolarPower Europe’s EU Solar Jobs & Skills Report 2024 projects that the EU solar workforce needs to grow from approximately 600,000 direct jobs in 2023 to over 1.1 million by 2030 to meet the EU Solar Energy Strategy capacity targets. The report identifies installer workforce development as the single largest bottleneck to deployment acceleration in most EU member states — more limiting than module supply, grid capacity, or financing.
Wage trends
Solar installer wages in the US averaged $47,670/year in 2023 (BLS data), with experienced commercial installers and project managers earning $65,000–$85,000+. The wage premium for installers with commercial C&I experience and proficiency with professional-grade design tools has grown: employers increasingly specify BIM or solar simulation software proficiency in commercial installer job postings.
What this means for solar businesses
The workforce shortage is a strategic opportunity for installation companies that invest in training, systems, and tools that increase productivity per installer. An installer using professional solar design software with automated shade analysis and one-click proposal generation can complete a commercial site assessment and proposal in 2–3 hours instead of 8–12 hours. This is a labor-leverage multiplier — it means each skilled installer produces more revenue-generating proposals, which is the binding constraint in most installation businesses.
The Installer’s Role in the Solar Energy Transition
The solar installer is the last-mile actor in the energy transition. IEA capacity projections, IRENA cost curves, and government targets are only realized when an installer shows up at a site, designs the system correctly, and installs it to code. The scale of the transition — 500 GW/year of additions required globally through 2030 — implies an installer workforce operating at a pace that has no historical precedent.
This creates pressure but also opportunity. The installer who operates at scale, runs efficient operations, and serves customers well in a high-demand market is positioned to build a substantial business. The installer who remains transactional, dependent on manual quoting processes, and unable to differentiate on quality is the one who gets squeezed by price-competitive volume installers.
What separates tier-one installers in 2026
Based on patterns observed across commercial solar markets in Europe, the US, and Australia, the characteristics that define high-performing solar installation businesses in the current market share several common attributes:
- Fast, accurate proposals. Customers in post-parity markets are getting multiple quotes. The installer who delivers a detailed, professional proposal within 24–48 hours of site visit captures disproportionate share. Installers still delivering proposals 7–14 days after site visit are losing to faster competitors.
- Data-driven site assessment. Commercial clients — particularly those with engineering, procurement, or finance backgrounds — expect production estimates grounded in irradiance data, solar shadow analysis software, and documented assumptions. Rule-of-thumb estimates are not acceptable in a 200 kW rooftop project context.
- Clear ROI modeling. The ability to present 20-year cash flow projections, sensitivity analysis, and financing comparisons using a generation and financial tool in a clean, professional document is a capability that commands premium pricing and builds the referral relationships that drive business growth.
- Post-installation monitoring integration. Clients who can track their system’s performance online, receive alerts if production deviates from projections, and generate reports for financial reporting purposes are more satisfied and more likely to refer. Installers who offer monitoring integration build recurring touchpoints that generate upsell and referral revenue.
The technology stack that enables scale
The commercial solar installer operating at scale in 2026 typically uses: a solar design software platform for site assessment, production modeling, and shading analysis; solar proposal software for customer-facing documentation, pricing, and financing options; CRM software for pipeline management; and a project management tool for installation scheduling and permitting tracking.
The integration of design, proposal, and monitoring in a single platform reduces friction, reduces error rates, and reduces the time from lead to signed contract. The platforms that provide this end-to-end capability are accelerating competitive differentiation in the installation market.
Key Takeaway
The energy transition needs 500 GW/year of solar installations globally. The installer workforce is the bottleneck. Companies that invest in technology that multiplies installer productivity — faster site assessment, automated proposals, accurate production modeling — are building structural competitive advantages that compound as the market grows.
How Solar Design Software Evolves with the Market
The solar design and simulation software category is evolving rapidly, driven by the same market forces reshaping the broader industry: increasing project complexity, customer expectations for data-driven proposals, and the need to model technologies — bifacial, storage, V2G, agrivoltaics — that did not exist in the mainstream project pipeline five years ago.
From manual to automated site assessment
The first generation of solar design software — tools that required manual roof tracing, manual panel placement, and static production estimates — is being superseded by platforms that integrate satellite imagery, AI-based roof detection, LiDAR-driven 3D shading models, and automated panel layout optimization. What took a designer 90 minutes in 2018 takes 15 minutes in 2026.
For commercial installers handling 10–50 proposals per month, this time compression is not a convenience — it is a business model enabler. It is the difference between being able to pursue every qualified lead and having to prioritize by expected deal size.
Simulation accuracy: from rules of thumb to physics-based modeling
Production estimates are the foundation of every solar proposal. Inaccurate production estimates lead to misaligned customer expectations, warranty disputes, and damaged reputations. The evolution of simulation from simple irradiance-times-efficiency calculations to full physics-based modeling — accounting for diffuse and direct irradiance, spectral corrections, module-level temperature coefficients, rear-side irradiance for bifacial panels, inverter efficiency curves, and system degradation — has materially improved the accuracy of long-term production forecasts.
NREL’s System Advisor Model (SAM) and similar physics-based engines achieve simulation-to-actual production accuracy of within ±3–5% for well-characterized sites. Commercial solar software platforms that integrate these physics models provide installers with the credibility to stand behind their production estimates in front of sophisticated commercial clients.
Proposal software: from PDF to interactive financial models
The solar proposal has evolved from a static PDF to an interactive financial presentation. The best current platforms allow customers to explore:
- Multiple system sizes and configurations with instant financial recalculation
- Financing scenarios (cash, loan, lease/PPA) side by side
- Storage add-on economics with demand charge and time-of-use modeling
- 20-year and 25-year cash flow projections with inflation assumptions
- Environmental benefit quantification (tonnes CO₂ avoided, trees equivalent)
This interactivity shortens the customer decision cycle by reducing back-and-forth between the initial proposal and contract signing. When a customer can answer their own “what if I add a battery?” question from the proposal itself, the need for a follow-up meeting is eliminated.
What the next five years look like for solar design tools
The most significant near-term developments in solar solar design software platforms include:
- AI-driven layout optimization: Machine learning models trained on thousands of completed projects recommending optimal panel placement, string configuration, and inverter selection — not just placing panels on available roof area but optimizing for production, aesthetics, and structural loading simultaneously.
- Integrated permitting automation: Direct API connections to AHJ (Authority Having Jurisdiction) permit portals, automated generation of permit packages, and real-time permit status tracking within the design platform.
- Storage and V2G dispatch modeling: Full simulation of battery storage dispatch logic — including V2G, demand charge management, and VPP participation — integrated with solar production models.
- Agrivoltaic and ground-mount optimization: Tools for elevated mounting configuration, row pitch optimization for bifacial gain, and crop yield impact modeling for agrivoltaic projects.
- Real-time monitoring integration: Closing the loop between proposal-stage production estimates and actual system performance, creating feedback that improves future simulation accuracy.
The trajectory is toward an integrated platform that manages the entire customer lifecycle — from satellite-based lead qualification through design, proposal, permitting, installation documentation, and post-installation monitoring. Installers who build their business on platforms moving in this direction are building on a foundation that scales with the market.
For a deeper look at how technology is transforming system intelligence in the field, see our guide to smart solar panels and the broader picture of solar’s environmental impact.
Design, Simulate & Propose Faster with SurgePV
SurgePV gives commercial solar installers accurate production modeling, bifacial simulation, storage economics, and professional proposal generation — all in one platform built for the pace of the 2026 market.
Book a DemoNo commitment required · 20 minutes · Live project walkthrough
The 2026–2035 Solar Market in Summary
The future of solar energy through 2035 is defined by several compounding trends that individually represent significant shifts — and collectively represent a transformation of the energy system.
Cost curves continue downward. Module costs have one more structural step-change ahead when perovskite-silicon tandems reach commercial scale at approximately 2028–2030. Between now and then, the gradual compression of balance-of-system and soft costs through automation and standardization continues.
Technology complexity increases. The project of 2030 is not the project of 2020. Bifacial simulation, storage dispatch optimization, V2G integration, and agrivoltaic configuration are all capabilities that the competitive installer needs in their toolkit — either through specialized knowledge or through the software platforms that encode that knowledge.
The market rewards professionalism. As the industry matures, customers — particularly commercial and industrial buyers — demand more from their solar providers. Data-driven production estimates, professional proposals, and post-installation performance accountability are table stakes, not premium service offerings.
The installer workforce is the binding constraint. IRENA, IEA, and SolarPower Europe all identify skilled installer shortage as the primary deployment bottleneck in most markets through 2030. Companies that invest in productivity-enhancing tools and training are building competitive positions that are difficult to replicate at speed.
Software is the leverage point. The installers and installation companies that capture the most value from the solar transition will be those who combine field expertise with professional-grade solar design software and solar proposal software — tools that let each skilled professional handle more projects, design more accurately, and close more contracts.
The energy transition is happening. The question is which companies and professionals are positioned to capture the opportunity it creates.
FAQ
What is the future of solar energy by 2030?
According to the IEA’s World Energy Outlook 2024, solar PV is on track to become the single largest source of electricity generation globally by the early 2030s, with total installed capacity exceeding 5,000 GW by 2030 under the Stated Policies Scenario. IRENA projects solar could supply 25% of global electricity by 2030. Annual capacity additions are forecast to reach 500–700 GW/year through the decade, driven by China, the US, India, and the EU.
Will solar energy costs continue to fall?
Yes. Module prices fell roughly 90% between 2010 and 2024 following Swanson’s Law — a 20% cost reduction for every doubling of cumulative shipments. BloombergNEF projects further module price declines of 30–40% through 2035 as manufacturing scales and perovskite tandem cells approach commercial production. Balance-of-system and soft costs, which now represent 60–70% of residential system cost, are also declining as digital design automation and standardized permitting reduce overhead.
What is perovskite solar and when will it be commercially available?
Perovskite solar cells have achieved lab efficiencies above 34% in tandem configurations with silicon, compared to 22–24% for standard commercial silicon panels. Commercial perovskite-silicon tandem modules are expected to reach market between 2026 and 2028 from manufacturers including Oxford PV and CubicPV. The primary commercialization barrier is long-term stability — early field deployments must demonstrate 25-year degradation rates below 0.5%/year to compete with silicon.
How will solar energy and battery storage integrate by 2035?
IRENA projects that solar-plus-storage will represent the majority of new capacity additions globally by 2030. Lithium iron phosphate battery costs fell below $100/kWh at the pack level in 2024. By 2035, virtual power plant aggregation, V2G integration, and AI-driven dispatch will make distributed solar-storage assets routinely competitive with peaking gas plants.
What is agrivoltaics and how fast is it growing?
Agrivoltaics is the co-location of solar panels and agricultural activity on the same land. The global agrivoltaic market is projected to grow from $3.1 billion in 2023 to $9.3 billion by 2028, a 25% CAGR. Multi-year research confirms most crops maintain 80–95% of reference yields under appropriate panel configurations. Policy support in Japan, France, Germany, Italy, and the US is creating viable project economics.
Which countries have reached solar grid parity?
Unsubsidized solar self-consumption is already economically positive without subsidy in Germany, Italy, Australia, California, Japan, Spain, Brazil, and India, among others. In these markets the all-in payback period for a residential or commercial system is 4–10 years, with 20-year net returns that are strongly positive. Markets approaching grid parity by 2030 include Mexico, Thailand, Vietnam, and several sub-Saharan African economies where unreliable grid supply makes solar-storage cost-competitive today.
How many solar jobs will there be by 2030?
Global solar employment was approximately 4.9 million jobs in 2023 (IEA). The EU alone needs to grow its solar workforce from 600,000 to over 1.1 million by 2030 to meet capacity targets. In the US, the BLS projects solar installer employment to grow 22% by 2032, reaching an estimated 380,000–420,000 positions. Solar installer wages in the US averaged $47,670/year in 2023, with commercial specialists earning $65,000–$85,000+.