The number of solar panels you need comes down to three numbers: your annual energy consumption, your location's peak sun hours, and the wattage of the panels you choose. Get those three right and the rest is arithmetic.
This chapter walks through each step with worked examples for Germany, Italy, Spain, the UK, and France. By the end, you'll have a panel count for your own home — or know exactly what to ask your installer.
Quick Answer
A typical European 3-bedroom home (4,500 kWh/yr) needs 10–16 panels (400W each) depending on location. German homes need more panels than Spanish homes for the same consumption because Germany gets fewer sun hours per year.
What you'll learn in this chapter:
- How to find your actual annual energy consumption
- What peak sun hours are and how to look them up
- Why real systems produce about 80% of their theoretical maximum
- The exact formula for calculating system size in kWp
- Worked examples for five European countries
- How battery storage affects the calculation
Quick Answer: The Formula
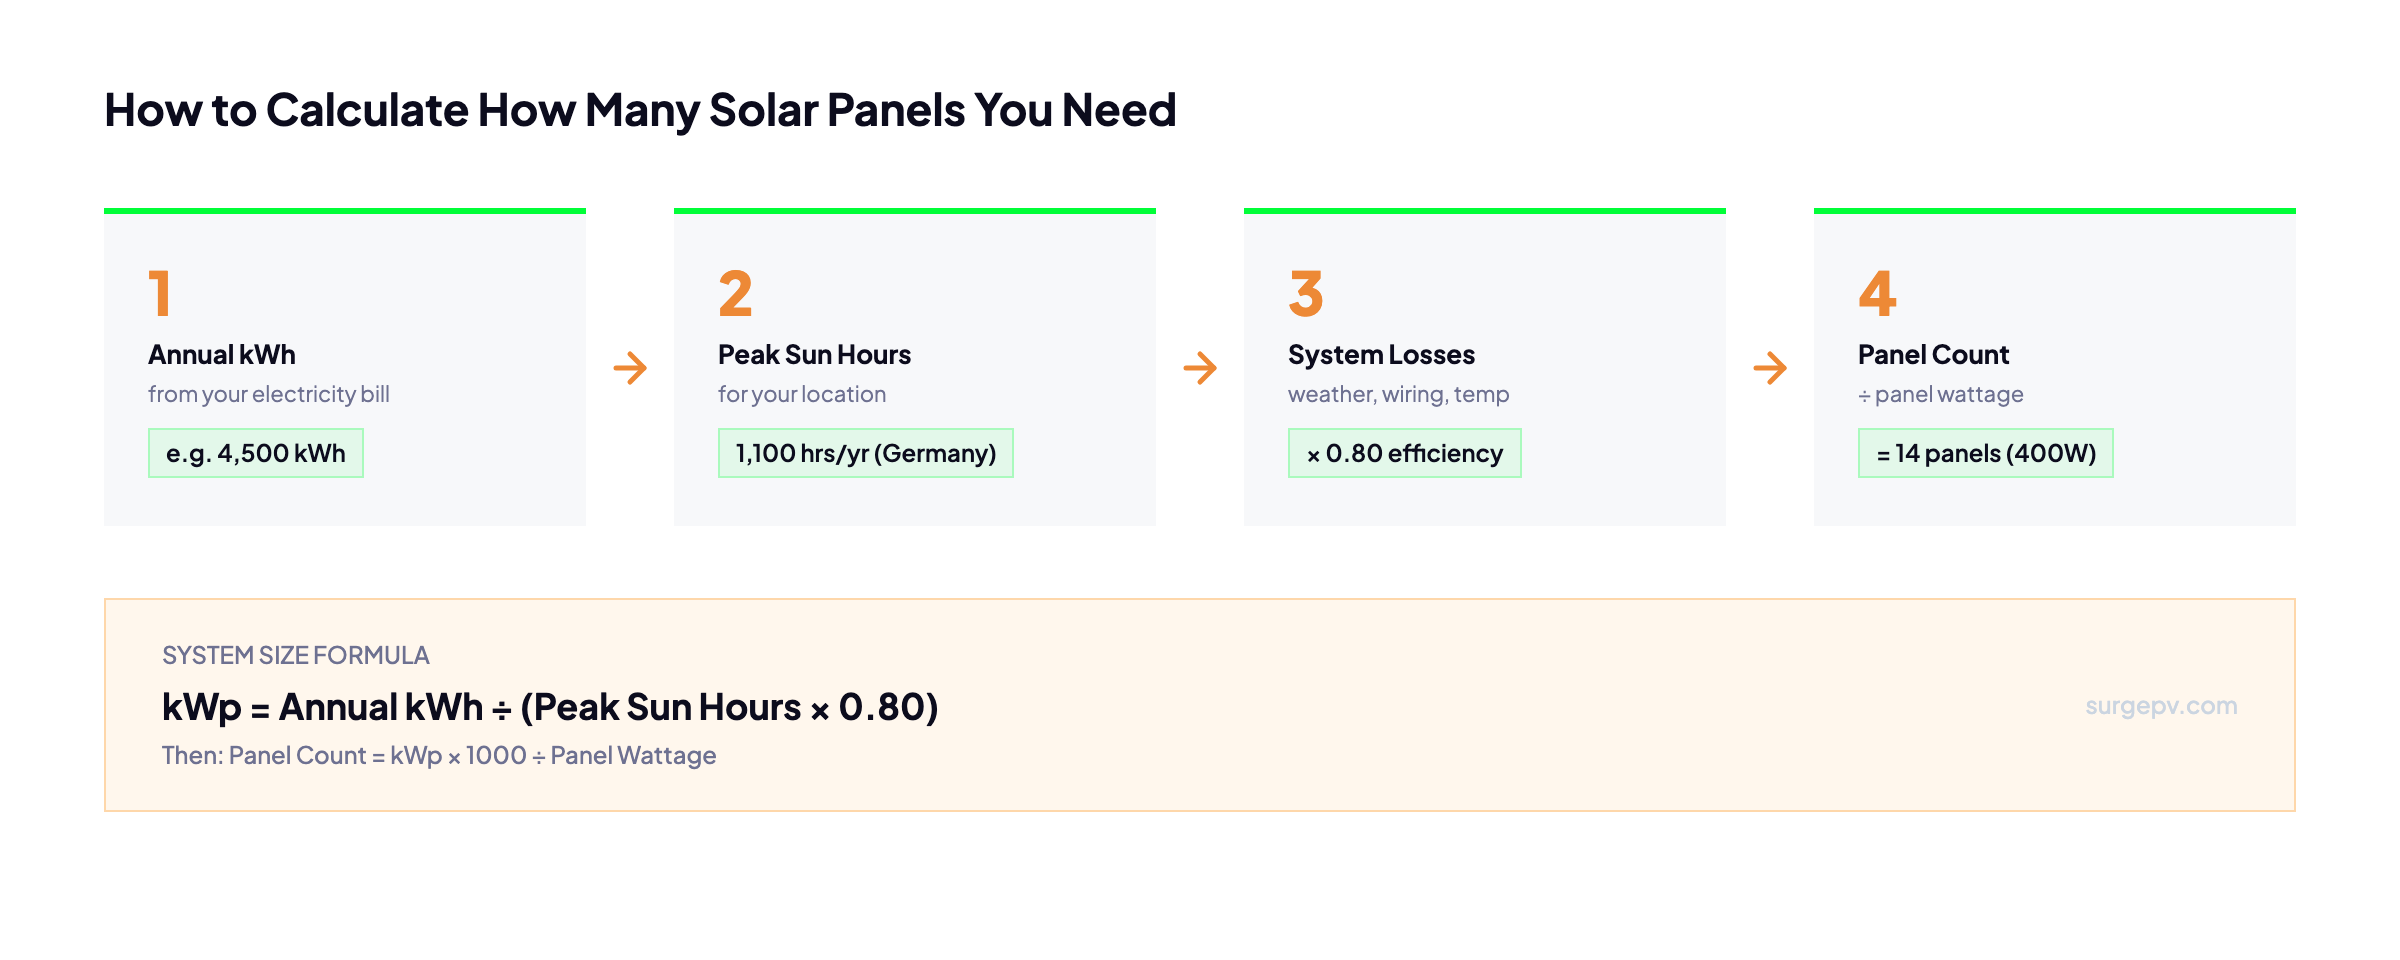
Here is the complete formula, broken into two steps:
Step 1 — System size: kWp = Annual kWh ÷ (Specific Yield × Performance Ratio)
Step 2 — Panel count: Panels = kWp × 1,000 ÷ Panel Wattage
For a home using 4,500 kWh/yr in Germany (specific yield ~1,050 kWh/kWp, performance ratio 0.80):
- kWp = 4,500 ÷ (1,050 × 0.80) = 4,500 ÷ 840 = 5.36 kWp
- Panels = 5,360 ÷ 400W = 13.4 → 14 panels
The four steps below explain where each number comes from and how to get your own.
Step 1: Find Your Annual Energy Consumption
Check your electricity bills. Most utility portals show a 12-month summary. Add up all kWh values for the past 12 months — that is your annual consumption figure.
If you can't find 12 months of bills, use the averages below as a starting point:
| Country | Average Household kWh/yr | Source |
|---|---|---|
| Germany | 3,500 | Eurostat 2023 |
| France | 4,100 | Eurostat 2023 |
| Spain | 3,300 | Eurostat 2023 |
| Italy | 2,700 | Eurostat 2023 |
| United Kingdom | 3,100 | Eurostat 2023 |
Pro Tip
Always use your actual bill data rather than national averages. A home with electric heating or an EV charger can easily double the average. Sizing to your real consumption avoids leaving money on the table.
For businesses, pull the 12-month total from your half-hourly metering data or ask your energy supplier for an annual consumption statement. Industrial and commercial sites often have demand charges layered on top — a professional solar design software tool will account for these separately.
Step 2: Find Your Local Peak Sun Hours
Peak sun hours are not the same as hours of daylight. They represent the number of equivalent hours per day at a reference irradiance of 1,000 W/m². A location that receives 5 kWh/m² of solar energy on a given day has 5 peak sun hours, even if the sun was up for 14 hours.
For annual system sizing, the most useful figure is specific yield — the annual energy output in kWh per kWp of installed capacity. JRC PVGIS publishes this data for every location in Europe, free of charge.
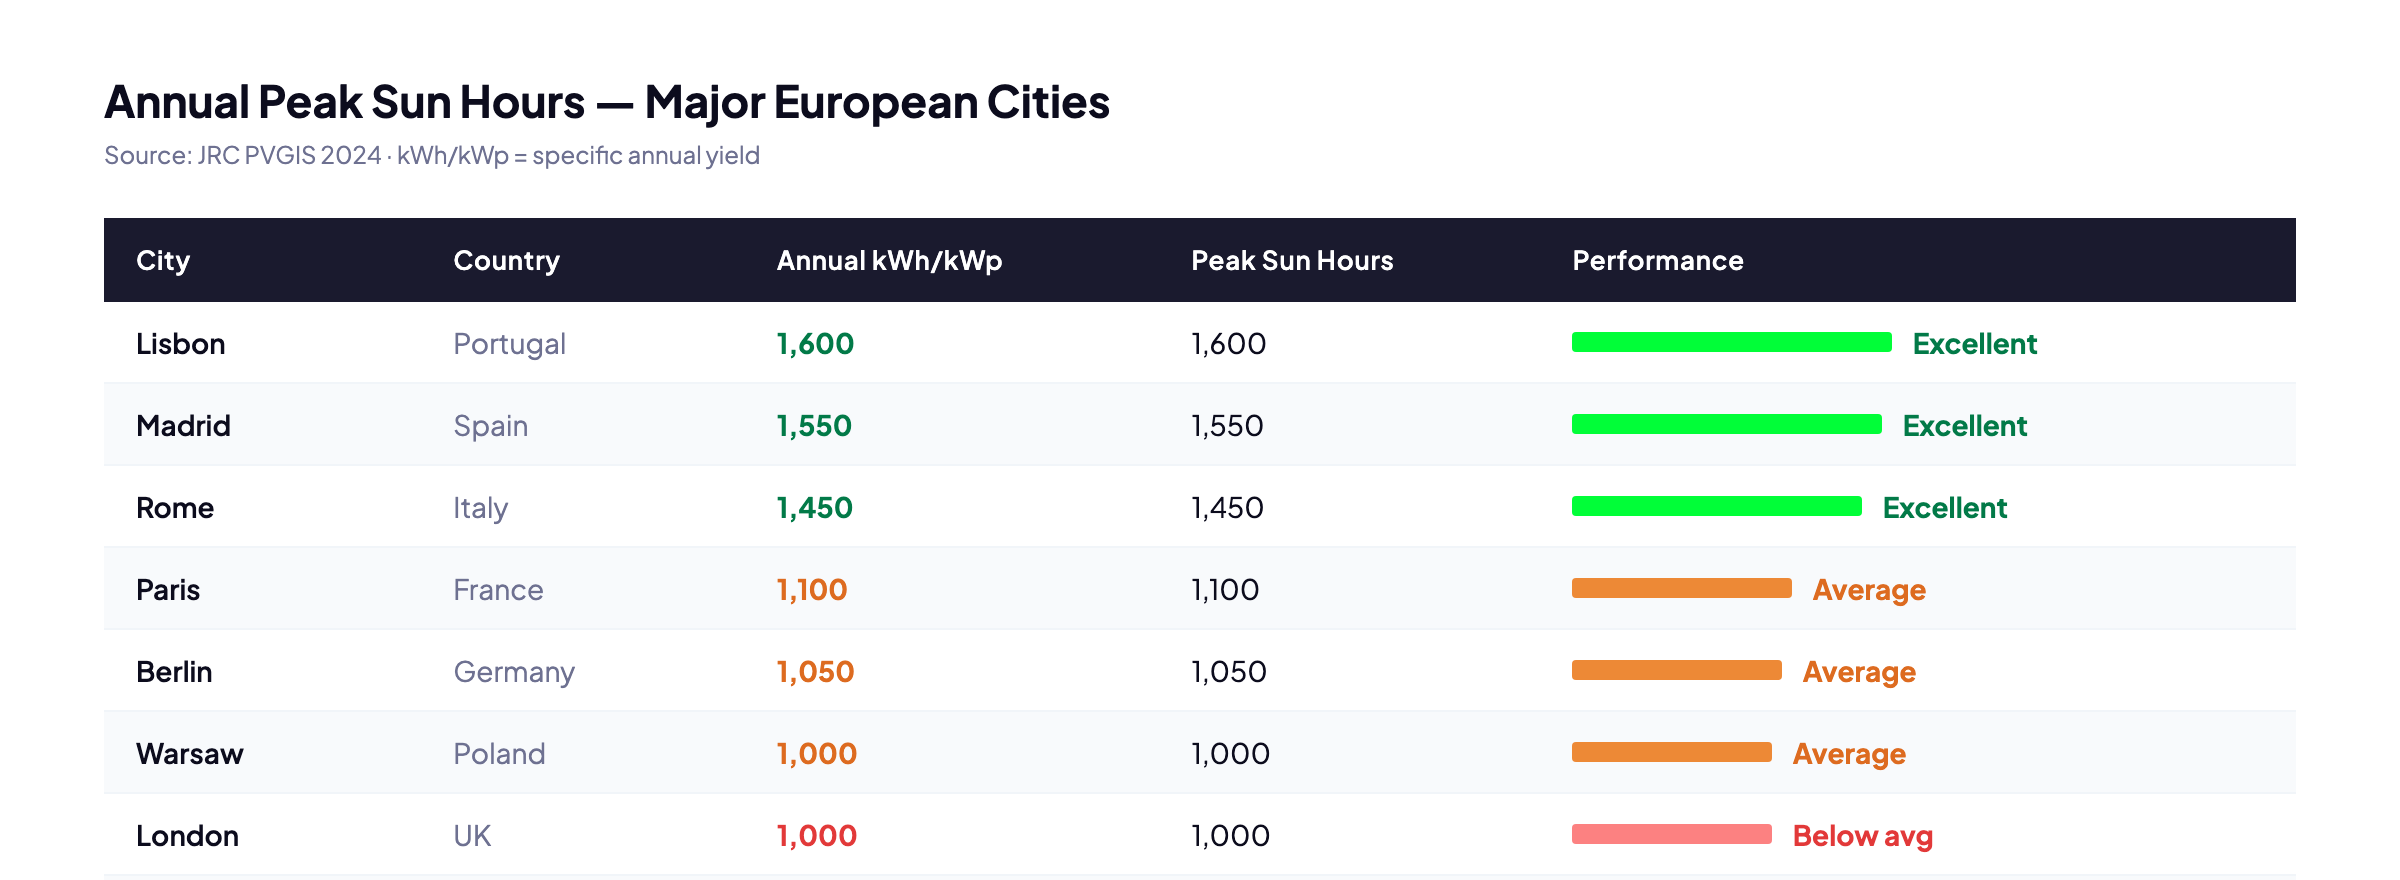
The table above shows the wide range across Europe. Lisbon gets 60% more solar energy per year than Amsterdam. That difference translates directly into fewer panels needed for the same output.
Key Takeaway
Use JRC PVGIS to get the specific yield for your exact address. Enter your coordinates, set the system type to "grid-connected," and read off the "Annual energy production per kWp" figure. This is the most accurate free tool available for European locations.
Roof orientation also matters. South-facing roofs at a 30–35° tilt get the maximum yield. East or west-facing roofs typically produce 15–20% less. A flat roof with optimised tilt brackets can match a south-facing pitched roof almost exactly.
Step 3: Account for System Losses
No solar system produces 100% of its theoretical output. Real-world losses come from several sources, and together they typically reduce output to around 75–82% of the theoretical maximum. This ratio is called the performance ratio (PR).
| Loss Source | Typical Loss Range | Notes |
|---|---|---|
| Temperature derating | 5–8% | Panels lose output as they heat above 25°C |
| Inverter efficiency | 2–4% | Modern string inverters run at 96–98% efficiency |
| DC/AC wiring losses | 1–2% | Resistive losses in cables |
| Soiling and dust | 2–3% | More in dusty or urban environments |
| Shading | 0–15% | Highly variable — worst for north-facing obstructions |
| Mismatch and ageing | 1–2% | Small variation between panels in the same string |
Adding these up, a well-designed unshaded system runs at a PR of 78–82%. Use 0.80 as a sensible conservative figure for initial sizing. If your roof has significant shading, use 0.72–0.75 and verify with a proper solar shadow analysis.
Why This Matters
Skipping the performance ratio and sizing purely from panel wattage is the single most common cause of undersized systems. A 10-panel system rated at 4 kWp does not produce 4 kWh every hour of peak sun — it produces roughly 3.2 kWh after losses.
Step 4: Calculate Your Panel Count
With your three numbers in hand, the calculation is straightforward:
System size in kWp:
kWp = Annual kWh ÷ (Specific Yield × PR)
Panel count:
Panels = (kWp × 1,000) ÷ Panel Wattage
Always round up to the nearest whole panel. If you get 13.2 panels, install 14.
Most installers today use 400W–430W panels. Using a higher wattage means fewer panels for the same system size, which reduces racking, wiring, and labour costs. For a straightforward sizing exercise, 400W is a reasonable working figure.
Once you have a system size, you can model the full financial return using the generation and financial tool — which shows annual savings, payback period, and 25-year ROI based on your local electricity tariffs.
Pro Tip
Use a solar sizing calculator to run multiple scenarios quickly. Try different panel wattages and orientations to see how much the panel count changes before committing to a design.
Worked Examples for 5 European Countries
The table below applies the formula to a typical household in each country, using national average consumption figures (Eurostat 2023) and specific yield data from JRC PVGIS for each capital city. All examples use 400W panels and a performance ratio of 0.80.
| Country | Annual kWh | Specific Yield (kWh/kWp) | System Size (kWp) | Panel Count (400W) |
|---|---|---|---|---|
| Germany | 3,500 | 1,050 | 4.17 kWp | 11 panels |
| France | 4,100 | 1,100 | 4.66 kWp | 12 panels |
| Italy | 2,700 | 1,450 | 2.33 kWp | 6 panels |
| Spain | 3,300 | 1,550 | 2.66 kWp | 7 panels |
| UK | 3,100 | 1,000 | 3.88 kWp | 10 panels |
Notice how Italy and Spain need far fewer panels than Germany or France, despite not being dramatically lower consumers. The difference is entirely in the sun hours — Italian panels work harder for every kWp installed.
These figures assume south-facing roofs at optimal tilt. An east/west split in Germany would push the panel count from 11 to around 14. That's why a detailed site-specific design matters. Solar design software handles this automatically by modelling the exact roof orientation, tilt, and shading for your address.
Model Your System Size in Minutes
SurgePV calculates your exact panel count using PVGIS irradiance data, your roof geometry, and real panel specs.
Book Free Demo20 minutes · Live walkthrough · No commitment
Does Adding a Battery Change the Calculation?
Adding a battery storage system does not change the fundamental panel count calculation. You are still sizing for annual production — the battery just shifts when you use that energy.
That said, there is one practical reason to slightly oversize when adding battery storage: winter charging. In northern Europe, December and January days are short and often overcast. A system sized to cover exactly 100% of annual consumption may not charge a battery fully on short winter days.
The usual approach is to oversize the solar array by 10–15% when pairing with batteries. For the German example above (11 panels), that means going to 12–13 panels. The extra summer production either charges the battery faster or gets exported — both outcomes are better than running short of power in January.
Battery sizing is a separate calculation. The chapter on Adding Battery Storage to Solar covers battery capacity, depth of discharge, and how to size a battery for your specific overnight consumption.
Key Takeaway
Panel count is driven by annual energy production targets. Battery size is driven by daily consumption patterns and overnight energy needs. The two calculations are linked but separate.
Frequently Asked Questions
How many solar panels do I need for a 3-bedroom house?
A 3-bedroom home in Europe typically uses 3,500–5,000 kWh per year. Using the formula with 400W panels, that works out to 10–16 panels depending on your country. German homes need closer to 14–16 panels; Spanish homes need 10–12 for the same consumption, because Spain gets more annual sun hours. Use your actual electricity bill for a precise answer.
How many solar panels do I need to power my whole house?
Take your annual kWh from your electricity bill and divide by your location's specific yield (from JRC PVGIS) multiplied by 0.80. That gives your system size in kWp. Divide by your panel wattage to get panel count. For a 4,500 kWh home in Germany: 4,500 ÷ (1,050 × 0.80) = 5.36 kWp, which is 14 panels at 400W each.
Do more panels always mean more savings?
Up to 100% coverage of your consumption, each extra panel directly reduces your grid electricity bill. Beyond that, additional production earns export income — but usually at a lower rate than the avoided purchase price. Oversizing by 10–15% makes sense if you plan to add battery storage or an EV charger in the future.
Ready to Size Your Solar System?
See how SurgePV turns your address and electricity bill into a full panel layout and financial model in under 10 minutes.
Book Free DemoNo credit card · Full access · Unlimited projects
About the Contributors

CEO & Co-Founder · SurgePV
Keyur Rakholiya is CEO & Co-Founder of SurgePV and Founder of Heaven Green Energy Limited, where he has delivered over 1 GW of solar projects across commercial, utility, and rooftop sectors in India. With 10+ years in the solar industry, he has managed 800+ project deliveries, evaluated 20+ solar design platforms firsthand, and led engineering teams of 50+ people.