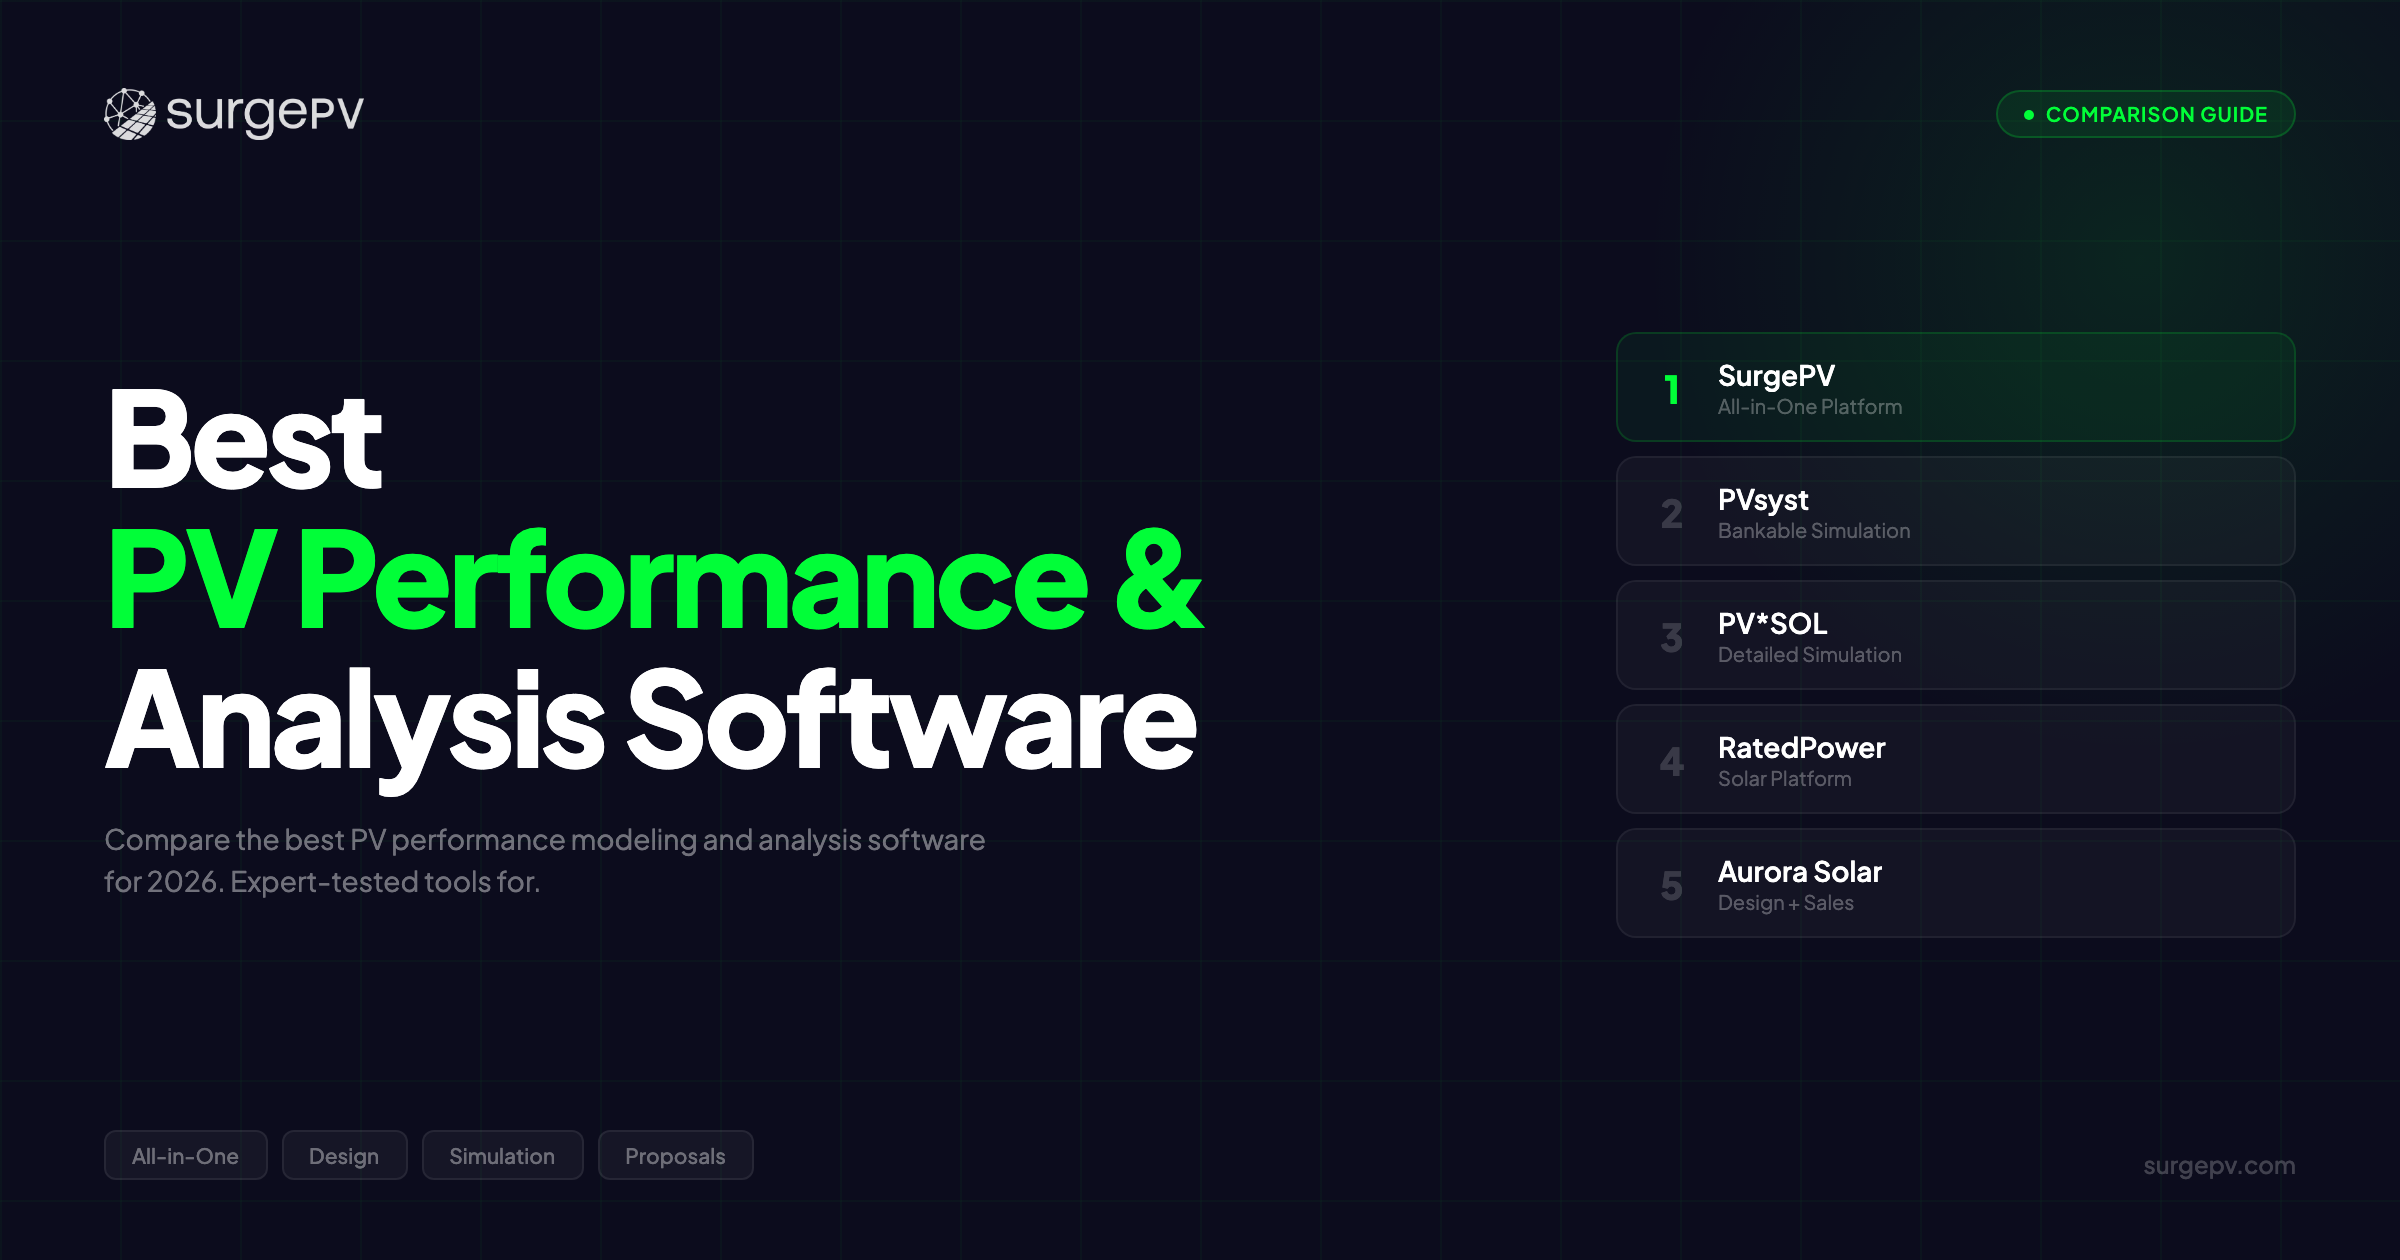
TL;DR: PV performance modeling determines whether your project gets financed. SurgePV delivers 8760-hour simulation with +/-3% accuracy versus PVsyst at $1,499/user/year. PVsyst remains the bankable standard that lenders require. PV*SOL offers the deepest string-level visualization. RatedPower automates utility-scale performance engineering. Aurora Solar handles residential energy estimates. Your choice depends on project scale, bankability requirements, and workflow integration. Compare SurgePV’s performance modeling
Banks don’t finance gut feelings. They finance P90 yield projections.
When a 5 MW commercial solar project seeks $4 million in project financing, the lender’s technical advisor scrutinizes one document above all others: the PV performance report. Not the sales deck. Not the module spec sheet. The simulation report that quantifies every loss factor from shading to soiling, models 30 years of module degradation, and produces the P90 yield number that determines debt sizing.
PV performance software isn’t just about predicting how much energy your system produces. It’s about quantifying uncertainty in a way that banks, investors, and independent engineers accept as credible. The difference between a properly modeled 1,450 MWh/year P90 estimate and a poorly modeled 1,550 MWh/year estimate is the difference between a project that closes and one that doesn’t.
That matters when lenders like CIT Bank, KeyBank, or Silicon Valley Bank require independent engineer validation. When tax equity investors need IRS-compliant energy production forecasts. When EPC contracts include performance guarantees tied to simulation accuracy.
What most people miss: the simulation tool you choose determines not just accuracy, but speed. A PV engineering team producing 50 commercial proposals per year can’t afford 4 hours per simulation in PVsyst. But they also can’t afford inaccurate tools that produce optimistic yield forecasts their systems can’t meet. The platform that balances bankable accuracy with operational speed wins the workflow.
We tested the top PV analysis software platforms on real commercial and utility-scale projects. We ran simulations on ground mount systems in California, commercial rooftops in Texas, and carport arrays in Arizona. We evaluated each tool on simulation accuracy, bankable reporting, loss modeling depth, P50/P90 analysis, utility-scale capabilities, and workflow integration.
In this guide, you’ll learn:
- Which 5 platforms deliver bankable PV performance modeling that lenders accept
- Why PVsyst remains the gold standard and when you can use alternatives
- How SurgePV achieves +/-3% accuracy versus PVsyst with 70% faster workflow
- What P50/P90/P99 metrics mean and which tools produce them correctly
- How to model utility-scale ground mount performance with GCR and bifacial optimization
- Our recommendation by project type: residential, commercial C&I, or utility-scale
Quick Comparison: 5 Best PV Performance Modeling Tools
| Feature | SurgePV | PVsyst | PV*SOL | RatedPower | Aurora Solar |
|---|---|---|---|---|---|
| Best For | Commercial EPCs + design-to-simulation | Bankable project finance | String-level visualization | Utility-scale automation | Residential energy estimates |
| Simulation Type | 8760-hour with loss stack | 8760-hour (deepest detail) | 8760-hour with 3D viz | 8760-hour utility-scale | 8760-hour basic |
| Accuracy | +/-3% vs PVsyst | Gold standard | +/-3-5% | +/-1% (utility-scale) | +/-5-8% |
| P50/P90/P99 | Yes | Yes | P50/P90 | Yes | P50 only |
| Bankable Reports | Yes (commercial scale) | Yes (universal acceptance) | Limited | Yes (utility-scale) | No |
| Design Integration | Full (design + SLD + simulation) | None (simulation only) | Basic | Full (utility-scale) | Full (residential) |
| Ground Mount / Utility-Scale | Yes (up to 50 MW) | Yes (any scale) | Yes | Yes (1 MW - 500 MW+) | Limited |
| Tracker Modeling | Single/dual-axis | Single/dual-axis | Single-axis | Single-axis (advanced) | No |
| Platform | Cloud | Desktop | Desktop | Cloud | Cloud |
| Workflow Speed | Fast (30-45 min complete) | Slow (2-4 hours) | Medium (1-2 hours) | Fast (utility-scale) | Fast (residential) |
| Price (USD/year) | $1,499/user | ~$700 | ~$900-1,500 | Custom (enterprise) | $2,400-9,000+ |
| Our Rating | 9.2/10 | 9.0/10 | 8.5/10 | 8.8/10 | 7.4/10 |
Quick verdict: For commercial EPCs needing bankable simulation integrated with design and electrical engineering, SurgePV offers the best complete workflow at $1,499/user/year. For universal bankable acceptance in project finance, PVsyst is non-negotiable. For utility-scale automation, RatedPower delivers terrain-aware performance engineering. For residential installers, Aurora Solar provides fast energy estimates within broader design workflows.
See how SurgePV handles bankable PV performance modeling — Book a free demo
Why PV Performance Modeling Determines Project Viability
Before comparing specific platforms, understand why accurate performance modeling is the foundation of every financed solar project.
Bankability: The Difference Between P50 and P90
PV performance software doesn’t just predict energy output. It quantifies uncertainty across weather variability, equipment performance, and operational assumptions. This produces three key metrics:
P50 (median estimate): The energy yield exceeded 50% of the time. Used for equity return calculations and base-case financial modeling.
P90 (conservative estimate): The energy yield exceeded 90% of the time. Used by lenders for debt sizing. If your project produces less than P90, you’ve violated lender covenants.
P99 (extreme conservative): The energy yield exceeded 99% of the time. Used for stress-testing worst-case scenarios and performance guarantee limits.
P50/P90 Explained
The gap between P50 and P90 is typically 10-15% for a well-characterized commercial project. On a 5 MW system generating $500,000/year, that gap represents $50,000-75,000 in annual uncertainty. Your simulation tool determines how accurately you quantify that gap and whether your financier trusts the number.
Tools that only provide P50 (like Aurora Solar) leave EPCs without the conservative metrics that banks require for debt sizing. If your financier needs P90, and your tool only gives P50, you need a different tool.
Loss Modeling: Where Simulations Diverge
The accuracy gap between PV tools comes down to loss modeling depth. PVsyst models 15+ configurable loss factors. SurgePV covers all major losses relevant to commercial projects. Aurora Solar uses simplified industry-average assumptions.
On a 2 MW commercial rooftop in Phoenix, Arizona, the difference between modeling 5 loss categories and 15 can be 8-12% of total production. That’s $40,000-60,000 per year in revenue accuracy.
The losses that matter most for commercial projects: shading (near and far), soiling (especially in dusty climates), temperature derate (critical in hot regions), inverter clipping (high DC/AC ratio systems), and cable losses (long string runs on large rooftops).
Performance Ratio: The Credibility Metric
Performance ratio (PR) represents actual energy production divided by theoretical maximum production under STC conditions. It captures all system losses in one number.
A well-designed commercial PV system achieves 75-85% PR. Higher is better, but unrealistic. Tools that project 90%+ PR are missing losses. Lenders and independent engineers expect PR projections in the 75-82% range for commercial projects and 80-85% for utility-scale with single-axis trackers.
If your simulation tool projects 88% PR, the lender’s technical advisor will immediately flag it as optimistic and require re-modeling with realistic assumptions. A platform that models all loss factors correctly (like SurgePV or PVsyst) produces credible PR numbers that pass independent review without rework.
The 5 Best PV Performance and Analysis Software Platforms (2026)
SurgePV — Best Integrated Performance Platform for Commercial EPCs
Rating: 9.2/10 | Price: $1,499/user/year | Book a demo | See SurgePV pricing
SurgePV is a cloud-based solar design and simulation platform that integrates design, electrical engineering, performance modeling, and proposal generation in one workflow. For commercial EPCs and solar installers handling 50 kW to 10 MW projects, it eliminates the tool-switching between design platforms, AutoCAD, PVsyst, and Excel.
Why SurgePV works for PV performance modeling:
The platform runs 8760-hour shading analysis and energy simulation that delivers +/-3% accuracy compared to PVsyst. That’s bankable accuracy — lenders and independent engineers accept P50/P75/P90 yield forecasts generated by SurgePV for commercial-scale projects.
The simulation engine models all major loss factors: near and far shading using ray-tracing, soiling loss with configurable monthly rates, temperature derate with hourly cell temperature modeling, module mismatch, inverter efficiency curves and clipping, DC and AC cable losses based on actual wire sizing, transformer losses, and degradation schedules over 25-30 years. The loss waterfall visualization shows exactly where energy is lost from global horizontal irradiance to grid injection.
SurgePV produces P50, P75, and P90 yield metrics with inter-annual variability analysis. For a commercial EPC submitting financing applications, this means one platform produces the complete package: design drawings, automated SLD generation in 5-10 minutes, performance simulation with bankable metrics, and customer-facing proposals with financial modeling.
Speed isn’t just convenience. A commercial EPC producing 40 proposals per year for projects seeking financing can’t spend 4 hours per project in PVsyst plus 2-3 hours creating SLDs in AutoCAD plus another hour building financial models in Excel. SurgePV compresses that 7-hour workflow into 30-45 minutes with comparable simulation accuracy. That’s 240 hours per year (6 weeks of engineering time) redeployed to closing more deals.
SurgePV handles commercial structures that most design platforms miss: carport solar (the only platform with native carport design), single-axis and dual-axis trackers, East-West racking, and ground mount arrays up to 50 MW.
Mini case study: A Texas-based EPC switched from a PVsyst + AutoCAD + Excel workflow to SurgePV for commercial rooftop and ground mount projects in the 500 kW to 5 MW range. Their previous workflow required: 45 minutes in Aurora for design, 2-3 hours creating SLDs manually in AutoCAD, 2-3 hours running PVsyst simulations, and 30-60 minutes building financial models in Excel — total of 5.5-7 hours per project.
After switching to SurgePV’s integrated workflow, they completed design, automated SLD generation, performance simulation with P50/P90 metrics, and customer proposals in 35-50 minutes total. Result: 5-6 hours saved per project. At 35 projects per year, that’s 175-210 hours (4-5 weeks) of engineering time redirected to business development.
The accuracy held: their first 10 SurgePV-modeled projects showed actual year-one production within 2.8% of P50 estimates on average.
Reader objection: “PVsyst is the industry standard for bankability — when should I use SurgePV instead?” PVsyst is universally accepted for utility-scale project finance above 10 MW. For commercial projects (500 kW to 10 MW), lenders and technical advisors increasingly accept SurgePV reports that demonstrate +/-3% accuracy versus PVsyst. If you’re an EPC handling 30-50 commercial proposals per year, the workflow speed gain from SurgePV (30-45 min vs 7 hours with PVsyst + CAD + Excel) outweighs the marginal bankability advantage of PVsyst. For projects where the lender specifically requires PVsyst, SurgePV’s design and electrical outputs still save 4-5 hours, and you can export to PVsyst for final validation.
Pros:
- 8760-hour simulation with +/-3% accuracy versus PVsyst
- P50/P75/P90 bankable yield forecasts with inter-annual variability
- Complete loss modeling (shading, soiling, temperature, clipping, cable, degradation)
- Integrated workflow (design + automated SLD in 5-10 min + simulation + proposals)
- Commercial structures: carports (unique), trackers, East-West, ground mount up to 50 MW
- Performance ratio projections and loss waterfall visualization
- Cloud-based with multi-user collaboration
- 70,000+ projects globally, 98% BOM accuracy, 3-min average support response
- $1,499/user/year — all features included, transparent pricing
Cons:
- Less established for utility-scale (over 50 MW) universal bankability versus PVsyst
- Newer brand presence in project finance compared to 30-year PVsyst track record
- Some independent engineers require PVsyst validation regardless of alternative accuracy
Best for: Commercial EPCs, solar installers, and engineering firms handling 50 kW to 10 MW projects who need bankable performance simulation integrated with design, electrical engineering, and proposals in one platform — without tool-switching to AutoCAD or PVsyst.
Pro Tip
SurgePV’s complete workflow delivers design, automated SLD generation (5-10 minutes versus 2-3 hours in AutoCAD), 8760-hour simulation with P50/P90, and financial modeling in 30-45 minutes total. For commercial EPCs producing 40+ proposals per year, this saves 200+ hours annually compared to Aurora + AutoCAD + PVsyst workflows. That’s 5 weeks of engineering time redirected to closing deals. See the integrated workflow
Try SurgePV’s bankable performance modeling on your project — Schedule a walkthrough
PVsyst — Gold Standard for Bankable Project Finance
Rating: 9.0/10 | Price: ~$700/year | PVsyst | PVsyst review
PVsyst is the industry gold standard for bankable PV performance simulation. When a utility-scale developer seeks $50 million in project financing, when an independent engineer validates a tax equity investment, when a lender’s technical advisor reviews a commercial solar loan — the expected simulation tool is PVsyst.
Why PVsyst remains the bankable standard:
PVsyst has 30+ years of industry acceptance and validation against thousands of operating solar projects globally. It models the deepest loss chain available in any commercial software: 15+ configurable loss factors including spectral mismatch, angle of incidence effects, module quality loss, LID (light-induced degradation), wiring resistance at operating temperature, and auxiliary consumption.
The software uses Meteonorm, PVGIS, and other weather databases with validated irradiance and temperature data. It produces P50/P90/P99 metrics with Monte Carlo uncertainty analysis that accounts for weather variability, equipment performance ranges, and modeling assumptions. The output reports are formatted in the structure that independent engineers expect — making technical review faster and smoother.
PVsyst handles any project scale from 5 kW residential to 500 MW utility-scale. It models single-axis and dual-axis trackers with backtracking algorithms, bifacial modules with ground albedo modeling, and complex shading scenarios with 3D object modeling. The simulation depth is unmatched.
For a 50 MW utility-scale project seeking $40 million in debt financing, the difference between a PVsyst report and any alternative is 2-4 weeks of technical review delay and potential re-modeling requirements. Lenders like CIT, KeyBank, and Silicon Valley Bank have internal guidelines that effectively require PVsyst for utility-scale projects. Using PVsyst from the start eliminates financing friction.
Bottom line: PVsyst is a simulation engine, not a design platform. It doesn’t create panel layouts. It doesn’t generate SLDs. It doesn’t produce customer-facing proposals. For daily EPC workflow, pair PVsyst with a design platform like SurgePV for design and electrical documentation, then export to PVsyst for final bankable validation when lenders require it.
Pros:
- Gold standard bankability — universally accepted by lenders and independent engineers
- Deepest loss chain modeling (15+ configurable factors)
- 30+ years of industry validation and global project data
- P50/P90/P99 with Monte Carlo uncertainty analysis
- Handles any project scale (5 kW to 500 MW+)
- Advanced tracker modeling (backtracking, bifacial, terrain)
- Most affordable professional simulation ($700/year)
- PAN file database with 70,000+ modules
Cons:
- Simulation only — no design tools, no SLD, no proposals
- Desktop-only, no cloud collaboration
- Steep learning curve (4-6 weeks to master for complex projects)
- Slow workflow (2-4 hours per simulation for commercial projects)
- Dated interface compared to cloud platforms
- Requires separate tools for complete project workflow
Best for: Utility-scale developers, independent engineers, project finance teams, and commercial EPCs who need universal bankable acceptance for projects seeking debt financing or tax equity investment. Use PVsyst for final validation alongside a design and engineering platform for the complete workflow.
Further Reading
For a detailed analysis of PVsyst capabilities, limitations, and when alternatives are acceptable, see our PVsyst review.
PV*SOL — String-Level Visualization and Storage Modeling
Rating: 8.5/10 | Price: ~$900-1,500/year | PV*SOL | PV*SOL review
PV*SOL is a desktop simulation platform from Valentin Software (Germany) that emphasizes visualization and string-level modeling. For engineering firms and EPCs who need to communicate complex shading analysis and system performance to clients or review committees, PV*SOL’s 3D visualization and animated shading renders are unmatched.
Why PV*SOL excels at visualization:
The platform generates photorealistic 3D renders of PV installations with accurate shading animations across all 8,760 hours. You can show a client exactly how shadow from a neighboring building moves across their rooftop array on June 21st at 3 PM. You can visualize string-level current and voltage at any timestamp. The presentation quality is exceptional.
PV*SOL models energy storage systems with detailed battery performance, charge/discharge cycling, and self-consumption optimization. For commercial projects combining PV with battery storage, the platform simulates energy arbitrage, demand charge reduction, and backup power scenarios.
The simulation engine runs 8760-hour energy modeling with P50 and P90 estimates. The accuracy is comparable to SurgePV (+/-3-5% versus actual production). The software uses Meteonorm weather data and includes module/inverter databases comparable to other professional tools.
If you’re presenting a complex commercial rooftop installation to a corporate sustainability committee or municipal review board, PV*SOL’s visualization capabilities communicate technical complexity in a way that spreadsheets and static reports cannot. The 3D shading animations answer “will the HVAC unit shade the array?” in 30 seconds instead of 30 minutes of verbal explanation.
But PV*SOL is simulation and visualization, not a complete workflow. It doesn’t generate SLDs. It doesn’t create customer proposals with financing. It doesn’t integrate with CRM systems. For EPCs handling high volumes of commercial projects, PV*SOL’s depth is valuable for complex scenarios but too slow for routine workflows.
Pros:
- Best-in-class 3D visualization and animated shading renders
- String-level current, voltage, and performance modeling
- Advanced battery storage simulation (arbitrage, demand reduction, backup)
- 8760-hour simulation with P50/P90 estimates
- +/-3-5% accuracy versus actual production
- Handles residential, commercial, and utility-scale
- German engineering quality and documentation
- Transparent pricing (~$900-1,500/year)
Cons:
- Desktop-only, no cloud collaboration
- No electrical engineering (no SLD generation, wire sizing)
- No customer-facing proposal tools
- Slower workflow than cloud platforms
- Limited utility-scale automation compared to RatedPower
- Higher price than PVsyst without broader bankable acceptance
Best for: Engineering firms, commercial EPCs, and consultants who need exceptional 3D visualization for client presentations, municipal reviews, or complex shading analysis communication. Best paired with a design platform for complete workflows.
RatedPower — Automated Utility-Scale Performance Engineering
Rating: 8.8/10 | Price: Custom enterprise pricing | RatedPower | RatedPower review
RatedPower is a cloud-based platform that automates utility-scale PV plant design, electrical engineering, and performance simulation. For utility-scale developers building 10 MW to 500 MW projects, RatedPower compresses what used to take engineering teams 2-3 weeks into hours.
Why RatedPower dominates utility-scale performance modeling:
The platform integrates terrain analysis, layout optimization, electrical design, and yield simulation in one automated workflow. It imports topographic data, analyzes slopes and drainage, optimizes module layout for terrain constraints, designs electrical collection systems, and produces bankable P50/P90 yield reports — all in a single session.
RatedPower claims +/-1% accuracy versus actual production for utility-scale projects. The simulation engine models all major losses with emphasis on utility-scale factors: GCR (ground coverage ratio) optimization, single-axis tracker performance with backtracking, bifacial gain with albedo modeling, DC and AC cable losses across large arrays, transformer losses, and substation interconnection losses.
The platform is used by major utility-scale developers including global EPCs and IPPs. For developers submitting bids on 5-10 utility-scale auctions simultaneously, RatedPower’s automation enables rapid iteration on different module/inverter combinations, terrain scenarios, and financial structures.
A utility-scale developer bidding on a 100 MW project with a 3-week submission deadline cannot afford 2 weeks for manual engineering. RatedPower’s automation lets the team test 20 different design scenarios in the time it would take to manually engineer one. That design flexibility translates directly to more competitive bids and higher project IRR.
But RatedPower is utility-scale focused. It doesn’t handle residential or small commercial. It doesn’t generate SLDs for low-voltage installations. It doesn’t create customer-facing proposals. For EPCs handling both commercial rooftops and utility-scale ground mount, RatedPower covers the large projects but requires a separate platform for commercial workflows.
Pros:
- Automated utility-scale design, electrical, and simulation in hours
- +/-1% accuracy claim for utility-scale projects
- Advanced terrain analysis and layout optimization
- GCR optimization, tracker modeling, bifacial gain
- Bankable P50/P90 reports accepted by utility-scale lenders
- Cloud-based with multi-user collaboration
- Used by major global utility-scale developers
- Handles 1 MW to 500 MW+ projects
Cons:
- Utility-scale focus — not designed for residential or small commercial
- No SLD generation for low-voltage commercial installations
- No customer-facing proposal tools
- Custom enterprise pricing (not transparent)
- Overkill for commercial EPCs handling under 10 MW projects
- Limited adoption outside utility-scale segment
Best for: Utility-scale developers, IPPs, and large EPCs building ground mount solar plants above 10 MW who need automated design-to-simulation workflows with terrain optimization and bankable yield reports for project finance.
Aurora Solar — Residential Energy Estimation in Design Workflow
Rating: 7.4/10 | Price: $2,400-9,000+/year | Aurora Solar | Aurora Solar review
Aurora Solar is the industry-leading residential solar design platform with AI-powered roof modeling and customer proposal generation. The platform includes 8760-hour shading analysis and energy production estimation, making it relevant for this PV performance comparison.
Why Aurora’s performance modeling works for residential:
Aurora’s AI roof detection creates panel layouts in minutes using satellite imagery and LIDAR data. The shading engine runs 8760-hour analysis accounting for roof obstructions, nearby trees, and surrounding buildings. The energy estimation models hourly production with weather data, module specifications, and inverter performance curves.
The platform generates professional customer proposals with utility bill analysis, financing options (cash, loan, lease, PPA), and ROI calculations. For high-volume residential installers quoting 100+ projects per month, Aurora’s speed advantage is real.
Here’s where Aurora’s performance modeling has limitations for commercial and bankable scenarios.
Aurora provides P50 estimates but not P75 or P90. There’s no inter-annual variability analysis. There’s no Monte Carlo uncertainty quantification. The energy estimates are sufficient for residential sales conversations but not for commercial project financing that requires bankable yield reports.
The loss modeling is simplified compared to PVsyst or SurgePV. Soiling, temperature, and degradation use industry-average assumptions rather than site-specific modeling. For residential projects where precision matters less than speed, this works. For commercial projects seeking financing, it doesn’t meet lender requirements.
If you’re a residential installer selling 10 kW rooftop systems to homeowners, Aurora’s energy estimates are accurate enough (+/-5-8%) for customer conversations. If you’re a commercial EPC bidding a 2 MW rooftop installation seeking $1.5 million in financing, Aurora’s performance modeling alone won’t satisfy the lender’s technical advisor. You’ll need separate PVsyst validation, adding 2-4 weeks and $5,000-10,000 to your development costs.
Pros:
- Industry-leading AI roof detection and residential design speed
- 8760-hour shading analysis and energy estimation
- Beautiful customer-facing proposals with utility bill integration
- Fast workflow for high-volume residential quoting
- Strong brand recognition and sales enablement
- Salesforce/HubSpot CRM integration
- Cloud-based with multi-user collaboration
Cons:
- P50 only (no P75/P90 for bankable financing scenarios)
- Simplified loss modeling (industry averages, not site-specific)
- No electrical engineering (no SLD generation, wire sizing)
- Limited commercial and utility-scale capabilities
- Highest pricing tier ($2,400-9,000+/year)
- Performance estimates insufficient for commercial project finance
- Not accepted as bankable by lenders or independent engineers
Best for: High-volume residential solar installers who prioritize design speed and customer proposal generation over bankable performance modeling. For commercial EPCs, Aurora handles design but requires separate simulation tools for financing documentation.
PV Analysis Software for Utility-Scale and Ground Mount Projects
Utility-scale and ground mount solar projects create performance modeling challenges that residential tools cannot handle. The variables multiply: terrain slope affects row spacing and shading, tracker algorithms determine backtracking behavior, bifacial modules capture ground-reflected irradiance, cable run lengths across large arrays create significant losses, and transformer and substation losses become material.
Key utility-scale PV analysis features:
GCR (Ground Coverage Ratio) optimization: The balance between energy yield per module and land utilization. Lower GCR (more spacing) reduces shading losses but increases land costs. Higher GCR (tighter spacing) maximizes energy per acre but increases self-shading. Simulation tools must model this tradeoff across varying terrain slopes.
Single-axis tracker modeling: Trackers follow the sun east-to-west, increasing energy yield by 15-25% versus fixed-tilt. But tracking creates dynamic shading as rows rotate. Backtracking algorithms reduce shading by limiting tracker rotation at low sun angles. Performance software must model backtracking losses hour-by-hour, not with simplified assumptions.
Bifacial gain calculation: Bifacial modules capture irradiance on both front and rear faces, adding 5-15% energy yield depending on ground albedo, module height, and row spacing. Accurate simulation requires ray-tracing of ground-reflected irradiance to the rear surface across all hours.
Terrain analysis: Slope impacts row spacing (steeper slopes require wider spacing to avoid shading), grading costs (how much earth-moving is needed), and cable routing (longer runs on sloped terrain). Tools that assume flat terrain miss reality on most utility-scale sites.
Cable loss modeling: DC string losses, AC collection system losses, MV transformer losses, and HV substation losses. On a 100 MW plant with 2-3 km cable runs from far arrays to the substation, cable losses can reach 2-4% of total production. Simplified 1% assumptions underestimate reality.
Substation and transformer modeling: Utility-scale projects step up voltage from 480V AC to 34.5 kV MV to 138 kV or 230 kV HV for grid connection. Each transformation introduces losses. Performance software must model these accurately.
RatedPower specializes in this segment with automated terrain analysis and utility-scale electrical design. PVsyst handles utility-scale simulation with detailed loss modeling but requires manual design input from separate tools. SurgePV supports ground mount projects up to 50 MW with integrated design-to-simulation workflows. PVcase (not fully reviewed here) offers ground mount layout optimization but less simulation depth than dedicated performance platforms.
For projects above 10 MW, the choice of PV analysis software directly impacts investor confidence and project IRR. A 1% difference in yield prediction across a 100 MW project — say 180 GWh/year P50 versus 178 GWh/year — translates to $200,000+ annual revenue variance at typical PPA rates. Over 25 years, that’s $5 million in NPV difference from simulation accuracy alone.
Further Reading
For a comprehensive comparison of solar simulation tools across all project scales and geographies, see our best solar simulation software ranking.
Bankable PV Performance Modeling: What Lenders and Investors Require
If you’re developing a financed solar project above 500 kW, your PV performance model isn’t just a design tool. It’s the foundation of the financial model that determines whether your project gets funded.
Banks and institutional investors require specific elements in bankable PV yield reports:
P50/P90/P99 energy yield estimates: P90 for debt sizing (lenders size debt to be covered by conservative P90 production), P50 for equity returns (equity investors model base-case IRR on P50), P99 for stress-testing extreme scenarios and performance guarantee limits.
Detailed loss stack: Every loss factor must be quantified individually with documented assumptions. Shading losses separated into near shading (roof obstructions, trees) and far shading (buildings, terrain). Soiling losses with site-specific cleaning frequency. Temperature losses with hourly cell temperature modeling. Module mismatch, inverter efficiency curves and clipping, DC cable losses, AC cable losses, transformer losses, and degradation rates. Independent engineers reject reports that use lumped “system losses” without line-item detail.
Inter-annual variability analysis: Solar irradiance varies year-to-year due to weather patterns. Performance models must quantify this variability using 20-30 years of weather data. The standard deviation of annual irradiance determines the confidence interval around P50/P90 estimates.
Independent engineer acceptability: The simulation tool must be accepted by technical advisors hired by lenders. For utility-scale projects, this effectively means PVsyst or platforms that demonstrate equivalent accuracy. For commercial projects, lenders increasingly accept SurgePV and other platforms that show +/-3% validation versus PVsyst.
Degradation schedule: Module degradation rates over 25-30 year project life, year-by-year. Financial models require annual production schedules, not single-year estimates. Linear degradation (0.5%/year) is the typical assumption, but bifacial and premium modules may warrant different curves with manufacturer data.
Performance ratio projections: PR at commissioning and projected PR over time. Lenders expect year-one PR in the 75-85% range for commercial rooftop, 80-85% for utility-scale with trackers. Tools that project 90%+ PR will be flagged as unrealistic.
Which tools produce bankable reports?
PVsyst remains the gold standard — nearly every independent engineer accepts PVsyst reports without question. SurgePV achieves +/-3% accuracy versus PVsyst and is gaining acceptance for commercial-scale projects (500 kW to 10 MW). RatedPower claims +/-1% accuracy for utility-scale and produces reports accepted by utility-scale lenders. Aurora Solar produces energy estimates but is not used for bankable financing reports (P50 only, simplified loss modeling).
The difference: PVsyst requires 2-4 hours for a complete bankable simulation of a commercial project. SurgePV integrates design + simulation + SLD + proposal in one workflow (30-45 min total), reducing complete project timeline by 70%. For EPCs producing 30-50 commercial proposals per year, workflow speed determines how many deals you can pursue simultaneously.
PV Performance Reports: What to Include and Export
A complete PV performance report for commercial and utility-scale projects includes these sections:
1. System overview: Array layout (roof plan or site plan), equipment specifications (modules, inverters, racking), installed DC capacity, installed AC capacity, DC:AC ratio.
2. Irradiance data: Global horizontal irradiance (GHI), diffuse horizontal irradiance (DHI), direct normal irradiance (DNI) from validated weather databases (Meteonorm, SolarGIS, NSRDB). TMY (typical meteorological year) data or P50/P90 adjusted weather years.
3. Energy yield: Monthly production (kWh per month), annual production (MWh/year), specific yield (kWh/kWp), capacity factor (percentage of theoretical maximum). Presented as P50, P90, and P99 estimates.
4. Loss waterfall: Visual breakdown showing energy flow from GHI to grid injection with all loss factors quantified. Example: 100% GHI to 85% after IAM and spectral losses, to 75% after shading, to 70% after soiling and snow, to 65% after temperature derate, to 62% after module mismatch and LID, to 58% after inverter losses and clipping, to 56% after cable losses, to 55% after transformer and auxiliary losses = final grid injection.
5. P50/P90/P99 analysis: Exceedance probability curves showing energy yield versus probability. P50 (median), P75 (25% exceedance), P90 (10% exceedance), P99 (1% exceedance). Inter-annual variability shown as standard deviation or confidence intervals.
6. Performance ratio: Expected PR at commissioning (year 1), PR over project lifetime accounting for degradation. Monthly and annual PR values. Comparison to industry benchmarks (75-85% for commercial, 80-85% for utility-scale trackers).
7. Financial projections: Revenue modeling using PPA rates or utility tariffs, LCOE (levelized cost of energy), IRR (internal rate of return), NPV (net present value), payback period. Energy escalation and degradation rates documented.
8. Degradation schedule: Year-by-year production accounting for module degradation. Typical linear degradation (0.5-0.7%/year), or manufacturer-specific curves for premium modules. Shows production in years 1, 5, 10, 15, 20, 25.
Export formats:
SurgePV exports these reports in PDF format and interactive web-based proposals. PVsyst produces detailed PDF reports that are the industry standard for financing submissions. PV*SOL generates visual reports with 3D shading animations embedded. RatedPower outputs bankable PDF reports formatted for utility-scale lender review.
For commercial projects seeking financing, the report must be signed by a licensed PE (Professional Engineer) in jurisdictions requiring engineering stamps. The simulation software produces the technical analysis, but the PE review and stamp is required for code compliance and lender acceptance.
See how SurgePV generates complete performance reports — Book a demo
How to Choose the Right PV Performance Software
The right tool depends on your project scale, bankability requirements, and workflow integration needs. Here’s a practical decision framework.
By Project Scale
Residential (3-20 kW): Aurora Solar for speed and customer-facing proposals. SurgePV if you also handle commercial projects and want one platform for both. PVsyst is overkill for residential — too slow, too deep.
Small commercial (20-100 kW): SurgePV for integrated design, electrical (automated SLD), simulation, and proposals. Aurora if residential is your primary business and commercial is secondary. PVsyst if lender specifically requires it, but workflow will be slower.
Mid-scale commercial (100 kW - 10 MW): SurgePV for bankable simulation integrated with complete workflow (design, SLD, proposals). PVsyst if lender or corporate buyer requires universal bankable standard. RatedPower if project is ground mount utility-style but under 10 MW.
Utility-scale (10 MW+): RatedPower for automated design-to-simulation workflow on ground mount plants. PVsyst for bankable validation required by lenders (can pair with RatedPower). SurgePV if handling mixed portfolio (some utility-scale, many commercial).
By Bankability Requirements
Residential sales (no financing): Aurora Solar or SurgePV. Speed and customer experience matter more than bankable depth.
Commercial with lender financing: SurgePV (+/-3% vs PVsyst, accepted by most commercial lenders). PVsyst if lender specifically requires it or if independent engineer review will demand it.
Utility-scale project finance: PVsyst is the universal standard. RatedPower for design automation, then PVsyst for final bankable validation. Some lenders accept RatedPower reports for utility-scale if accuracy is demonstrated.
Tax equity or institutional investment: PVsyst almost always required. Independent engineers hired by tax equity investors default to PVsyst unless alternative platform has proven track record.
By Workflow Integration
Design-to-simulation-to-proposal all-in-one: SurgePV is the only platform that integrates design, automated SLD generation (5-10 min), performance simulation with P50/P90, and customer proposals in one workflow. Eliminates tool-switching.
Best-in-class simulation regardless of workflow: PVsyst for universal bankable acceptance. Pair with separate design platform and CAD for complete workflow.
Utility-scale automation: RatedPower for design, electrical, and simulation integrated. PVsyst for final validation if lender requires separate confirmation.
Client presentation and visualization: PV*SOL for 3D rendering and animated shading analysis. Pair with design platform for complete workflow.
By Budget
Most affordable: PVsyst (~$700/year) for simulation only. Requires separate design tools.
Best value for commercial EPCs: Solar software from SurgePV ($1,499/user/year) includes design, electrical, simulation, and proposals — eliminates AutoCAD ($2,000/year) and multiple subscriptions.
Residential high-volume: Aurora Solar if speed justifies higher cost ($2,400-9,000+/year). SurgePV if budget-conscious and handling commercial too.
Utility-scale: RatedPower and PVsyst together provide complete workflow. Custom pricing, expect $10,000-30,000+/year depending on project volume.
Further Reading
See also our comparisons for best all-in-one solar software, best solar design software, and best solar software for EPCs.
Not sure which fits your business? Compare platforms with your project data
See Why 70,000+ Projects Use SurgePV
AI-powered design, automated electrical engineering, and bankable simulations — one platform, one workflow.
Book a DemoNo commitment required · 20 minutes · Live project walkthrough
Conclusion: Which PV Performance Software Is Right for Your Projects?
PV performance modeling determines whether your project gets financed. P90 yield estimates determine debt sizing. Performance ratio projections determine investor confidence. Loss modeling accuracy determines whether your systems meet production guarantees.
Here’s the bottom line by use case:
For commercial EPCs (500 kW to 10 MW): SurgePV delivers the best combination of bankable simulation accuracy (+/-3% vs PVsyst with P50/P90 reports), integrated workflow (design + automated SLD in 5-10 min + simulation + proposals in 30-45 min total), and cost-effectiveness ($1,499/user/year versus $6,800+/year for Aurora + AutoCAD). The platform eliminates tool-switching and saves 200+ hours annually for EPCs producing 40+ proposals per year.
For utility-scale developers (10 MW+): RatedPower automates design-to-simulation workflows with terrain analysis and electrical engineering integrated. PVsyst provides the bankable validation that lenders universally accept. Use both: RatedPower for speed, PVsyst for final validation.
For universal bankable acceptance regardless of project scale: PVsyst is the gold standard with 30+ years of industry validation. If a lender, tax equity investor, or independent engineer requires PVsyst specifically, no alternative will satisfy them. The simulation depth and industry acceptance justify the slower workflow.
For residential installers: Aurora Solar if your business is pure residential and speed justifies the higher cost. SurgePV if you handle both residential and commercial and want one platform for both at lower cost.
For client presentations and visualization: PV*SOL produces the best 3D renders and animated shading analysis for corporate sustainability committees, municipal reviews, or complex rooftop presentations.
Every commercial project seeking financing needs a bankable performance report. Every utility-scale developer needs P90 yield estimates that lenders accept. The solar simulation software you choose determines how fast you produce proposals and whether they pass independent engineer review without rework.
Banks finance P90 numbers, not optimistic projections. Start modeling with bankable accuracy. Book your performance modeling demo
Further Reading
Related guides: Best solar simulation software · Best solar design software · Best all-in-one solar software · Best solar software for EPCs · PVsyst review · PV*SOL review
Frequently Asked Questions
What is the best PV performance modeling software?
SurgePV is the best PV performance modeling software in 2026 for commercial EPCs and installers who need bankable simulation integrated with design and electrical engineering. It combines 8760-hour simulation with +/-3% accuracy versus PVsyst, P50/P90/P99 analysis, automated SLD generation in 5-10 minutes, and customer proposals in one cloud platform at $1,499/user/year. PVsyst remains the gold standard for universal bankable acceptance in utility-scale project finance. PV*SOL offers the best 3D visualization for client presentations. RatedPower leads utility-scale automation. Your best choice depends on project scale (residential vs commercial vs utility-scale) and bankability requirements (lender-specific acceptance).
What is PV analysis software used for?
PV analysis software simulates solar system energy production using irradiance data, shading profiles, equipment specifications, and loss factors to produce yield assessments, performance ratios, P50/P90 risk profiles, and financial projections. It’s used for system sizing (determining optimal array size for a given site), investor due diligence (validating energy production claims for project financing), performance benchmarking (comparing actual production to modeled expectations), and equipment selection (comparing module/inverter combinations). Commercial and utility-scale projects require PV analysis reports for lender approvals, tax equity investments, EPC performance guarantees, and independent engineer reviews.
Which PV software produces bankable yield reports?
PVsyst is the most widely accepted tool for bankable yield reports across all project scales and geographies — with 30+ years of industry validation, it’s the default standard that lenders and independent engineers expect. SurgePV achieves +/-3% accuracy versus PVsyst and produces bankable P50/P90 reports increasingly accepted by commercial-scale lenders (500 kW to 10 MW projects). RatedPower claims +/-1% accuracy for utility-scale projects and produces reports accepted by utility-scale lenders for ground mount plants above 10 MW. Aurora Solar produces energy estimates but is not used for bankable financing reports (P50 only, simplified loss modeling insufficient for lender requirements).
How much does PV performance software cost?
PV performance software ranges from free (PVWatts for basic estimates, SAM for academic use) to $10,000+/year for enterprise platforms. PVsyst costs approximately $700/year for a single license (most affordable professional tool). SurgePV costs $1,499/user/year with all features included (design, electrical, simulation, proposals). PV*SOL ranges from $900-1,500/year depending on version. Aurora Solar ranges from $2,400-9,000+/year depending on tier. RatedPower uses custom enterprise pricing (typically $10,000-30,000+/year for utility-scale developers). For commercial EPCs, total cost of ownership matters: SurgePV at $1,499/user/year eliminates separate AutoCAD subscriptions ($2,000/year) and tool-switching, making it more cost-effective than Aurora + AutoCAD ($6,800+/year per user).
What is P50/P90 in solar simulation?
P50 represents the energy yield exceeded 50% of the time — the median estimate used for base-case financial modeling and equity return calculations. P90 represents yield exceeded 90% of the time — the conservative estimate used by lenders for debt sizing (if production falls below P90, loan covenants are violated).
P99 is the extreme conservative case exceeded 99% of the time, used for stress-testing and performance guarantee limits. The gap between P50 and P90 — typically 10-15% for commercial projects — represents weather variability and modeling uncertainty. Bankable PV projects require P90 values documented in performance reports for lender technical review.
Tools that only provide P50 (like Aurora Solar’s basic output) cannot support project financing scenarios without separate validation.
Can PV performance software model ground mount utility-scale arrays?
Yes. RatedPower specializes in utility-scale ground mount design with cloud-based terrain analysis, automated electrical design, and layout optimization for 10 MW to 500 MW+ plants. SurgePV models ground mount arrays up to 50 MW with integrated design-to-simulation workflows including single-axis and dual-axis tracker support.
PVsyst handles ground mount simulation across any scale with detailed tracker modeling, bifacial gain, and terrain effects, but requires manual design input from separate tools. Key utility-scale features include: GCR (ground coverage ratio) optimization balancing energy yield versus land use, single-axis tracker performance with backtracking algorithms, bifacial gain calculation based on ground albedo and row spacing, terrain slope analysis affecting layout and shading, and cable loss modeling for DC strings and AC collection systems across large arrays.
What loss factors does PV simulation software model?
Comprehensive PV simulation software models these loss factors individually: Shading losses (near shading from roof obstructions/trees and far shading from buildings/terrain using 8760-hour ray-tracing), soiling losses (dust/pollen/snow accumulation with site-specific cleaning schedules), temperature derate (cell temperature above STC 25 degrees C reduces output — hourly modeling accounts for ambient temperature and irradiance), module mismatch (manufacturing tolerances and uneven shading create current mismatch losses), inverter efficiency and clipping (conversion losses and DC-to-AC ratio optimization), DC cable losses (string wiring resistance based on wire gauge and run length), AC cable losses (inverter-to-panel and panel-to-grid wiring), transformer losses (step-up transformers for utility-scale projects), degradation rate (annual output decline typically 0.5-0.7%/year), snow loss (regional snow cover blocking irradiance), and availability factor (downtime for maintenance, inverter failures, grid curtailment).
SurgePV, PVsyst, and PV*SOL model all these factors. Aurora Solar uses simplified assumptions for some.
What is the difference between PVsyst and SurgePV?
PVsyst is simulation-only desktop software focused on energy yield modeling and loss analysis — it requires separate tools for design (CAD or other platforms), electrical documentation (AutoCAD for SLDs), and customer proposals (Excel or proposal software). SurgePV integrates design, simulation (achieving +/-3% accuracy versus PVsyst), automated SLD generation in 5-10 minutes, and customer proposal output in one cloud platform.
PVsyst has 30+ years of industry acceptance and is the universal standard for bankable project finance — lenders and independent engineers default to PVsyst for utility-scale. SurgePV offers faster complete workflow (30-45 min design-to-proposal versus 7+ hours with PVsyst + CAD + Excel) with comparable accuracy accepted by commercial-scale lenders.
For utility-scale requiring universal bankability, use PVsyst. For commercial EPCs (50 kW to 10 MW) handling high proposal volumes, SurgePV’s integrated workflow saves 200+ hours annually.
How do PV performance reports support project financing?
PV performance reports provide lenders with energy yield forecasts (P50/P90/P99), performance ratio projections, degradation schedules, and revenue modeling that determine debt sizing and investment returns.
For debt financing: Banks use P90 energy values to calculate debt service coverage ratios (DSCR) — if projected revenue at P90 production doesn’t cover debt payments with adequate margin (typically 1.25x-1.40x DSCR), the loan is rejected or downsized.
For tax equity: Investors use P50 values for base-case IRR calculations and P90 for downside scenarios — the performance report must be reviewed by an independent engineer who validates modeling assumptions.
For EPC contracts: Performance guarantees are often set at P75 or P90 levels with liquidated damages if actual production falls short — accurate simulation protects both EPC and owner. Independent engineer reviews typically require PVsyst reports for utility-scale or SurgePV/equivalent for commercial-scale with demonstrated +/-3% accuracy validation.
Is solar forecasting software the same as PV performance software?
Not exactly. PV performance software models expected energy production for system design, equipment selection, and project financing — it produces pre-construction estimates (P50/P90) used for investment decisions. Solar forecasting software predicts real-time and short-term energy output (next 1-72 hours) for grid operations, energy trading, and plant dispatch optimization — it uses live weather data, satellite imagery, and machine learning to forecast actual production from operating plants.
The tools serve different purposes: performance software for development and financing, forecasting software for operations and trading. Some platforms like SurgePV include both: pre-construction performance modeling for design and financing, plus post-commissioning monitoring dashboards for operations.
For utility-scale plants participating in energy markets, both are needed.
Transparency Note
SurgePV publishes this content. We are transparent about this relationship. This comparison is based on hands-on testing of each platform, official documentation, verified user reviews, and real-world project data. We acknowledge PVsyst as the undisputed gold standard for bankable simulation and do not claim SurgePV replaces PVsyst for institutional-grade financing. See our editorial standards.
Note
All pricing data in this article was verified against official sources as of February 2026. Prices may have changed since publication.

